Find Trade Colleges
Culinary Arts at Long Beach City College
If you are interested in studying Culinary Arts, you may want to check out the program at Long Beach City College. Get started with the following essential facts.
Long Beach City College sits in Long Beach, CA.
For the most recent IPEDS reporting year, 51 culinary arts degrees were awarded at Long Beach City College.
Studying Online at Long Beach City College
Many students take online classes at Long Beach City College. Of 24,985 students, 7,218 (29%) studied exclusively online and 9,339 (37%) took at least some classes online.
Student Demographics & Diversity
The following sections describe the diversity of Culinary Arts graduates at Long Beach City College, broken down by degree level.
Program-wide, Culinary Arts graduates at Long Beach City College are 63% women (32) and 37% men (19).
Culinary Arts Associate’s Program at Long Beach City College
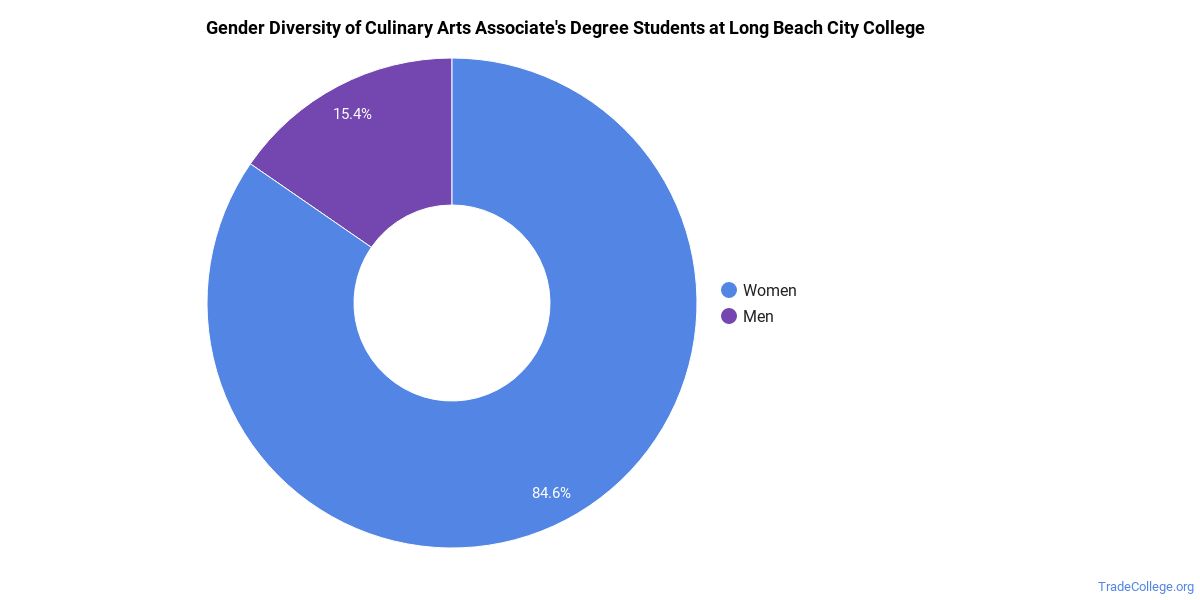
Among the 23 associate’s culinary arts degrees awarded at Long Beach City College, 65% were women (15) and 35% were men (8).
The following table and chart show the race/ethnicity of Culinary Arts associate’s degree recipients at Long Beach City College.
| Race / Ethnicity | Number of Graduates |
|---|---|
| White | 5 |
| Hispanic / Latino | 13 |
| Black / African American | 3 |
| Asian | 2 |
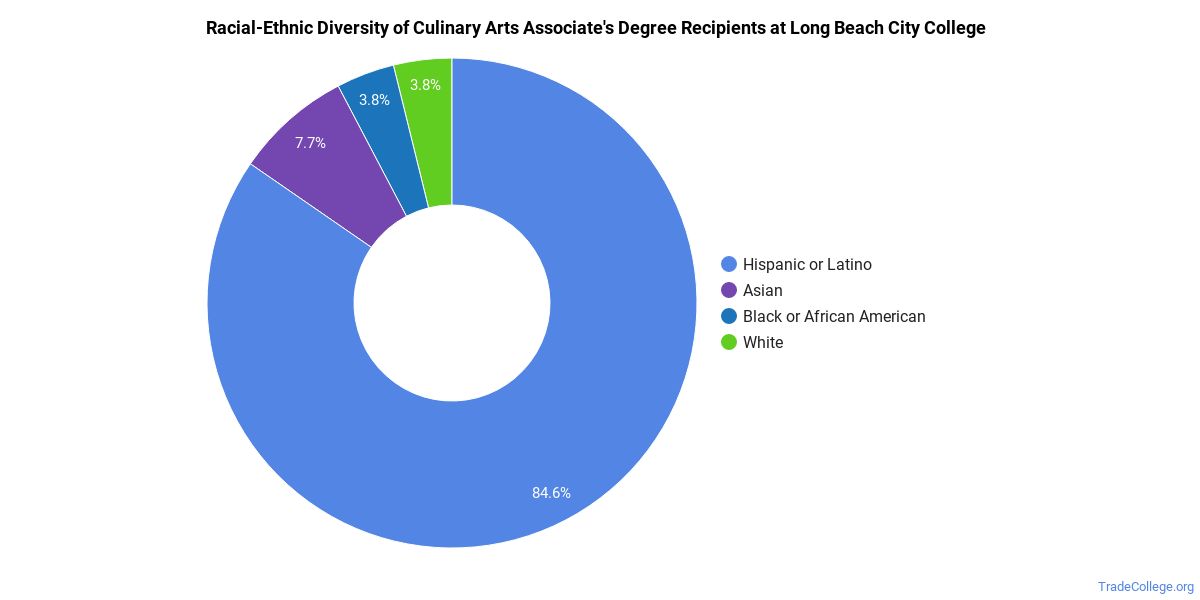
Racial-ethnic minorities make up 78% of Culinary Arts associate’s degree recipients at Long Beach City College, above the national average of 52%.*
*The racial-ethnic minorities figure is the total number of graduates minus White, international (nonresident), and unknown-race graduates.
More Specific Culinary Arts Concentrations at Long Beach City College
This Culinary Arts program at Long Beach City College includes the following sub-specializations:
| Concentration | Graduates |
|---|---|
| General Cooking & Culinary Arts | 51 |
Top-Paying Careers for Culinary Arts Graduates
Graduates of the Culinary Arts program at Long Beach City College work across a variety of fields. Below are the best-paid careers for Culinary Arts majors, ordered by median annual salary:
| Occupation | Nationwide Median Wage |
|---|---|
| Food Service Managers | $165,782 |
| Butchers and Meat Cutters | $50,662 |
| Slaughterers and Meat Packers | $47,691 |
| Bakers | $41,467 |
| Cooks, Restaurant | $41,438 |
| First-Line Supervisors of Food Preparation and Serving Workers | $37,104 |
| Cooks, All Other | $36,782 |
| Chefs and Head Cooks | $35,292 |
| Cooks, Private Household | $35,204 |
| Cooks, Institution and Cafeteria | $30,453 |
References
- IPEDS — Integrated Postsecondary Education Data System
- U.S. Department of Education — College Scorecard
- O*NET Online (Bureau of Labor Statistics)
- National Center for Education Statistics
More about our data sources and methodologies.
TradeCollege.org provides higher-education, college and university, degree, program, career, salary, and other helpful information to students, faculty, institutions, and other internet audiences. Presented information and data are subject to change. Inclusion on this website does not imply or represent a direct relationship with the company, school, or brand. Information, though believed correct at time of publication, may not be correct, and no warranty is provided. Contact the schools to verify any information before relying on it. Financial aid may be available for those who qualify. TradeCollege.org is a for-profit site, and the displayed options may include sponsored or recommended results, not necessarily based on your preferences.
© TradeCollege.org – All Rights Reserved.