Find Trade Colleges
Cooks, All Other: Career Overview
All cooks not listed separately.
What Do Cooks, All Other Do?
Types of Cooks, All Other Jobs
Common job titles for this role include:
- Assistant Cook
- Falafel Cart Cook
- Fraternity House Cook
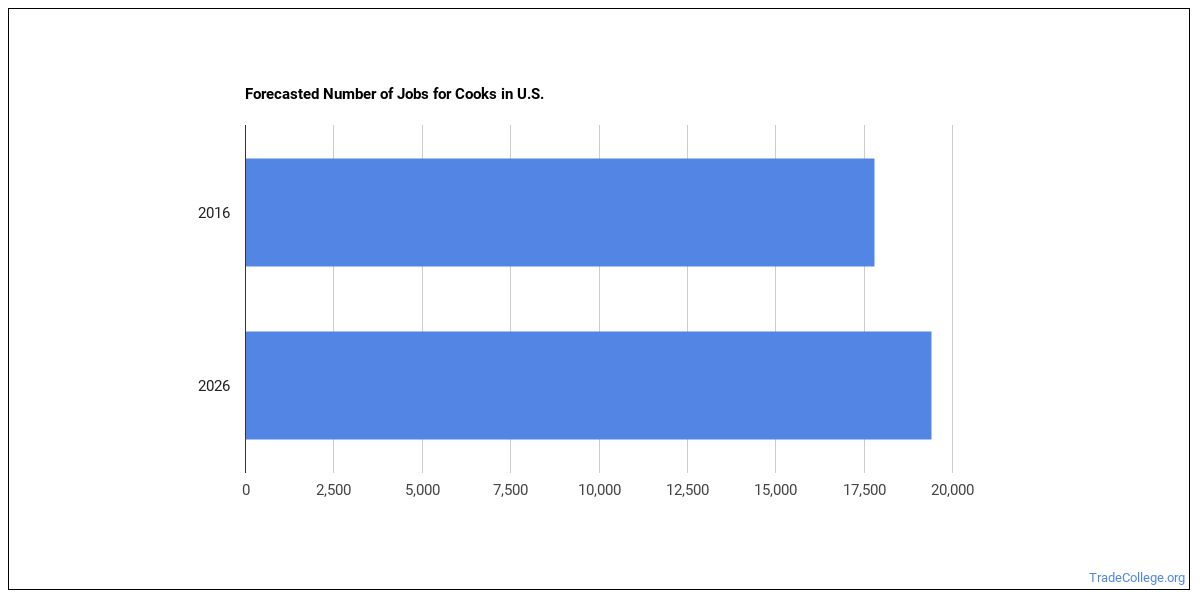
Employment and Demand
There are roughly 291,528 cooks, all other working in the United States today. This occupation is expected to grow by +4.4% over the projection horizon.
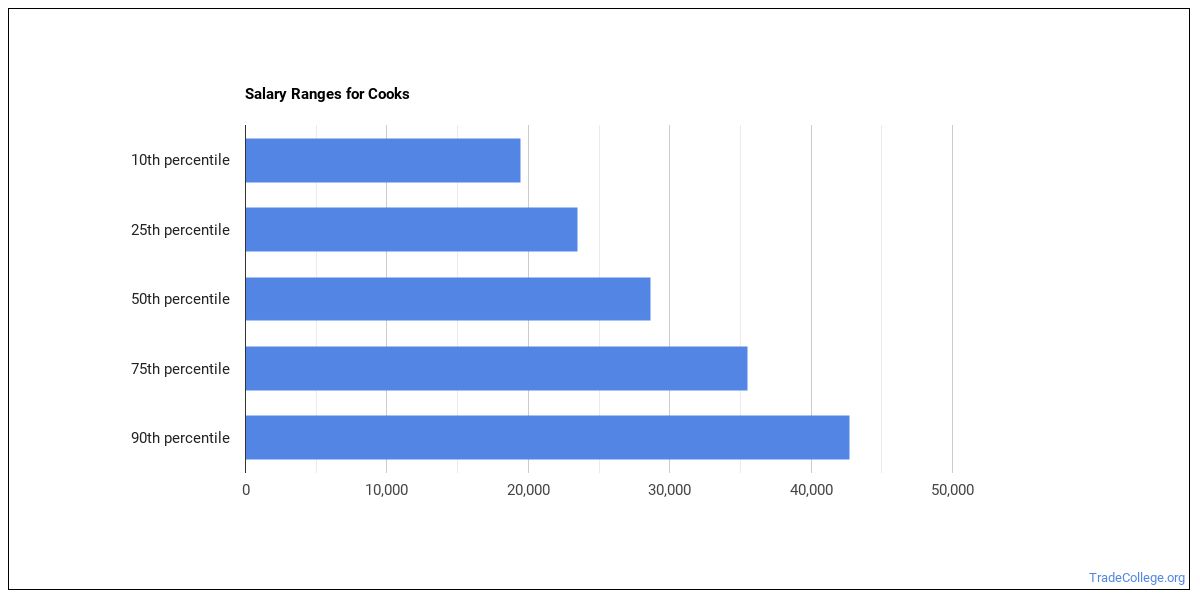
Salary for Cooks, All Other
| Statistic | Value |
|---|---|
| Annual median | $36,782 |
| Hourly median | $17.68 |
| 10th percentile | $26,677 |
| 25th percentile | $31,729 |
| 75th percentile | $41,834 |
| 90th percentile | $46,887 |
Pay can vary substantially based on experience, location, and industry.
How Much Do Cooks, All Other Make in Different U.S. States?
| State | Annual median salary |
|---|---|
| Massachusetts | $67,140 |
| Washington | $54,460 |
| Nevada | $49,600 |
| Illinois | $47,100 |
| Colorado | $46,730 |
| New Jersey | $44,490 |
| Alaska | $42,920 |
| Indiana | $42,290 |
| Kentucky | $42,240 |
| New York | $42,210 |
| Idaho | $41,850 |
| Montana | $41,220 |
| Oregon | $40,540 |
| Ohio | $40,090 |
| Vermont | $40,070 |
| Florida | $39,960 |
| California | $39,430 |
| Utah | $39,330 |
| Minnesota | $39,330 |
| South Carolina | $39,310 |
| Hawaii | $37,850 |
| North Dakota | $37,100 |
| Arizona | $36,280 |
| Michigan | $35,810 |
| Georgia | $35,580 |
| Tennessee | $35,350 |
| Connecticut | $35,100 |
| Pennsylvania | $35,030 |
| Missouri | $34,900 |
| Virginia | $33,930 |
| Maryland | $33,280 |
| Wisconsin | $32,760 |
| North Carolina | $31,810 |
| Iowa | $31,240 |
| Texas | $31,020 |
| Louisiana | $29,630 |
| Arkansas | $27,500 |
Pay by U.S. Region
Compensation for cooks, all other shift depending on where you work. Top regions by median wage:
| Region | Median annual wage | Share of U.S. jobs | Location quotient |
|---|---|---|---|
| New England | $46,767 | 3.2% | 1.68 |
| Rocky Mountains | $42,774 | 1.7% | 1.64 |
| Far Western US | $40,461 | 23.8% | 1.55 |
| Middle Atlantic | $38,867 | 14.9% | 1.09 |
| Great Lakes | $38,046 | 4.0% | 0.61 |
| Southeast | $35,438 | 25.9% | 3.00 |
| Plains States | $34,405 | 2.4% | 1.05 |
| Southwest | $31,478 | 24.1% | 2.30 |
Highest-Paying Metro Areas for Cooks, All Other
| Metro area | State | Median annual wage | Employment |
|---|---|---|---|
| Seattle-Tacoma-Bellevue, WA | WA | $56,870 | 50 |
| Louisville/Jefferson County, KY-IN | KY | $53,580 | 40 |
| Providence-Warwick, RI-MA | RI | $51,690 | 30 |
| Las Vegas-Henderson-North Las Vegas, NV | NV | $49,600 | 270 |
| Burlington-South Burlington, VT | VT | $48,510 | 100 |
| Denver-Aurora-Centennial, CO | CO | $48,330 | 70 |
| Chicago-Naperville-Elgin, IL-IN | IL | $47,100 | |
| Miami-Fort Lauderdale-West Palm Beach, FL | FL | $44,720 | 440 |
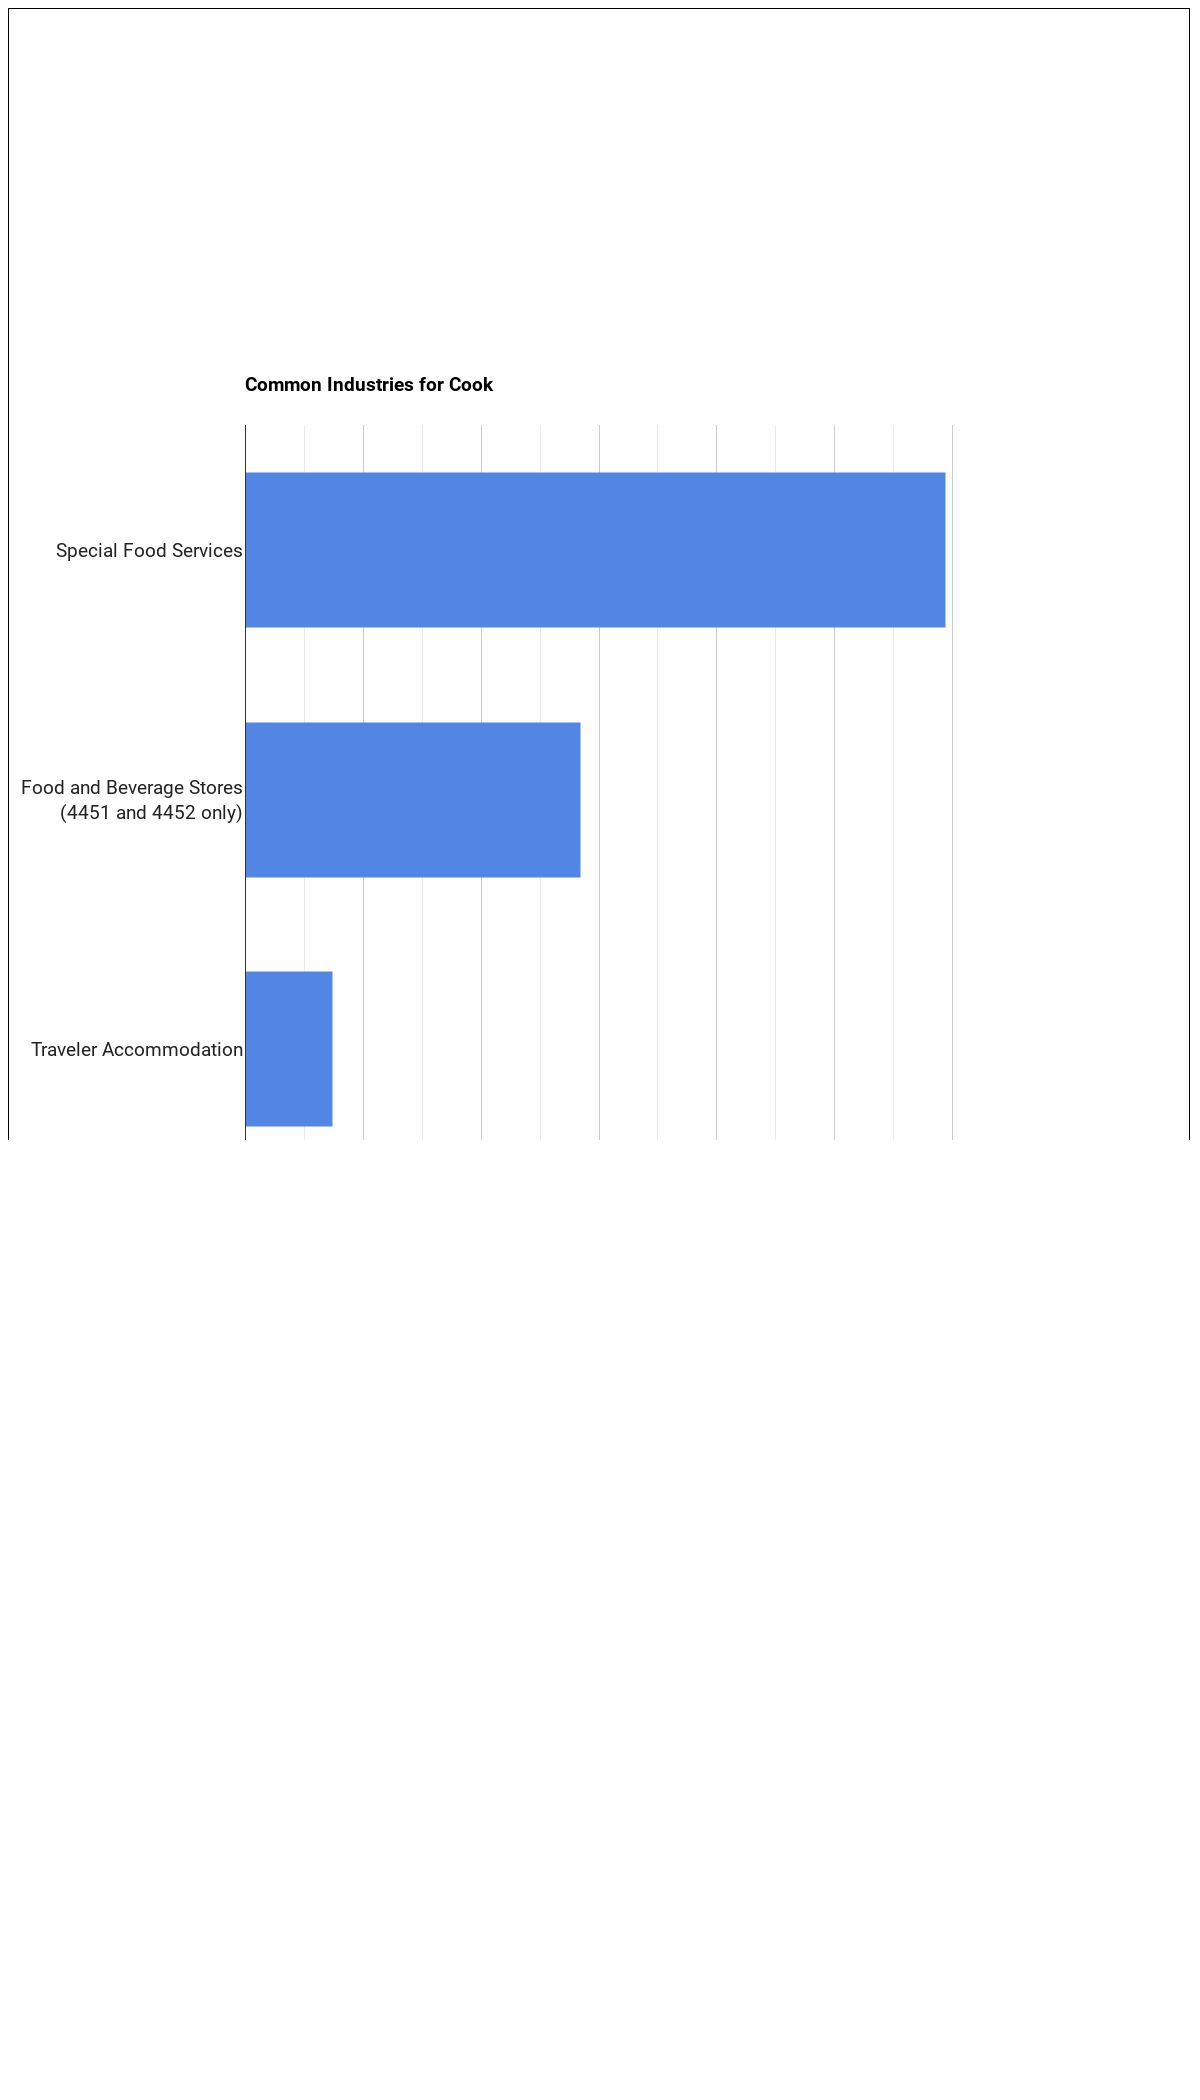
Top Industries Employing Cooks, All Other
The largest employers of cooks, all other work in these industries:
| Industry | Employment | Median annual wage |
|---|---|---|
| Accommodation and Food Services | 12,210 | $36,210 |
| Retail Trade | 3,000 | $33,550 |
| Manufacturing | 1,930 | $37,250 |
| Arts, Entertainment, and Recreation | 1,190 | $36,300 |
| Administrative and Support and Waste Management and Remediation Services | 1,070 | $38,640 |
| Health Care and Social Assistance | 1,070 | $35,700 |
| Information | 880 | $34,640 |
| Other Services (except Public Administration) | 600 | $35,760 |
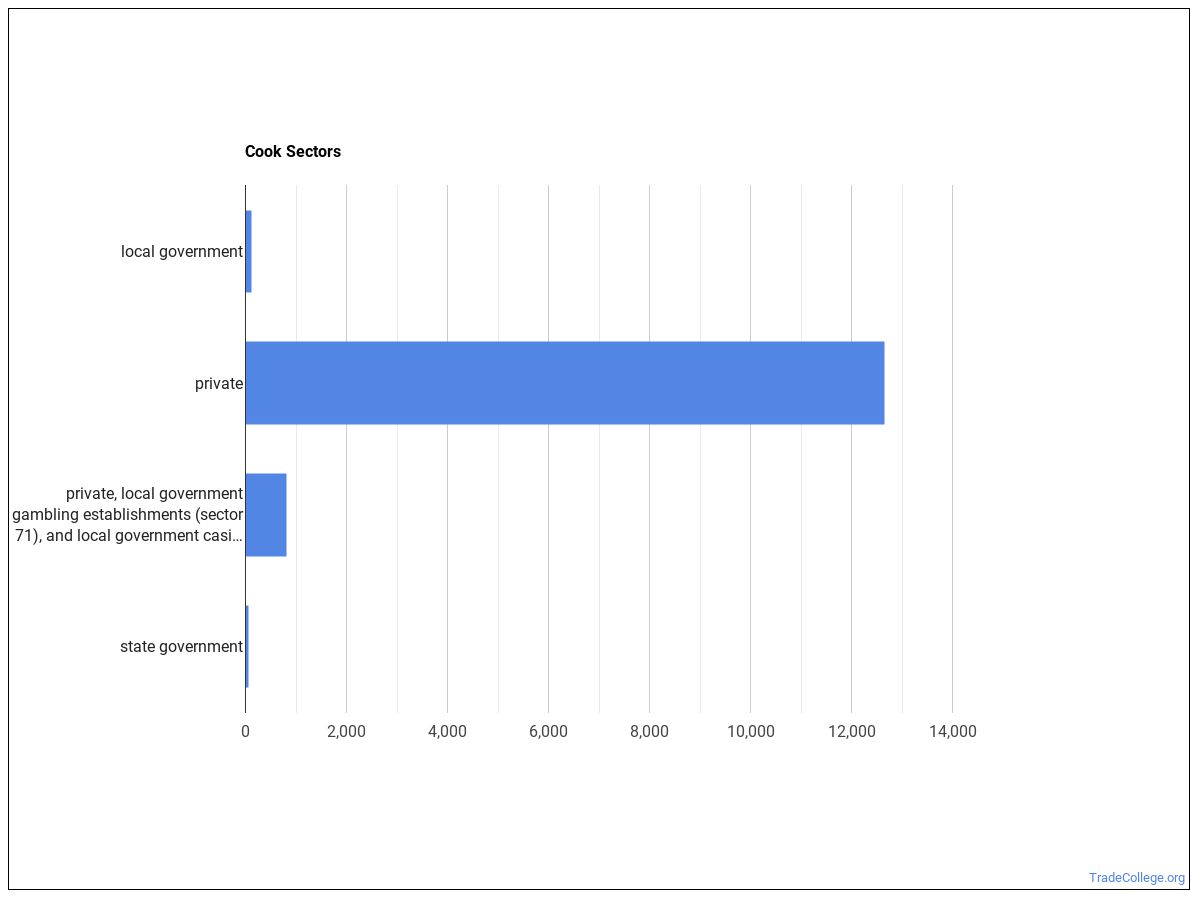
Cooks, All Other work in the following industries:
Top Programs to Study For This Career
Future cooks, all other typically earn programs in:
Personal and Culinary Services
4 programs across 1 majors
References
Statistics shown above are sourced from the following authoritative sources:
- U.S. Bureau of Labor Statistics — Occupational Employment and Wage Statistics (OEWS) for employment and wage data by state and industry.
- BLS Employment Projections for total employment and growth forecasts.
- O*NET (Occupational Information Network) for skills, knowledge, tasks, work activities, work context, technology, and education-zone data.
SOC code: 35-2019.00 (Cooks, All Other).
TradeCollege.org provides higher-education, college and university, degree, program, career, salary, and other helpful information to students, faculty, institutions, and other internet audiences. Presented information and data are subject to change. Inclusion on this website does not imply or represent a direct relationship with the company, school, or brand. Information, though believed correct at time of publication, may not be correct, and no warranty is provided. Contact the schools to verify any information before relying on it. Financial aid may be available for those who qualify. TradeCollege.org is a for-profit site, and the displayed options may include sponsored or recommended results, not necessarily based on your preferences.
© TradeCollege.org – All Rights Reserved.