Find Trade Colleges
Bartenders: Career Overview
Mix and serve drinks to patrons, directly or through waitstaff.
What Tasks Do Bartenders Take On?
Typical responsibilities of bartenders include:
- Clean glasses, utensils, and bar equipment.
- Collect money for drinks served.
- Balance cash receipts.
- Check identification of customers to verify age requirements for purchase of alcohol.
- Clean bars, work areas, and tables.
- Attempt to limit problems and liability related to customers' excessive drinking by taking steps such as persuading customers to stop drinking, or ordering taxis or other transportation for intoxicated patrons.
- Take beverage orders from serving staff or directly from patrons.
- Serve wine, and bottled or draft beer.
What Bartenders Need to Know
Effective bartenders rely on a mix of skills and domain knowledge.
Top Skills
The abilities most central to this role, rated on an importance scale of 0 to 5:
Top Knowledge Areas
Other Bartenders Job Titles
People in this occupation may also be known by titles such as:
- Banquet Bartender
- Bar Attendant
- Bar Captain
- Bar Tender
- Barkeep
- Barkeeper
- Barmaid
- Barman
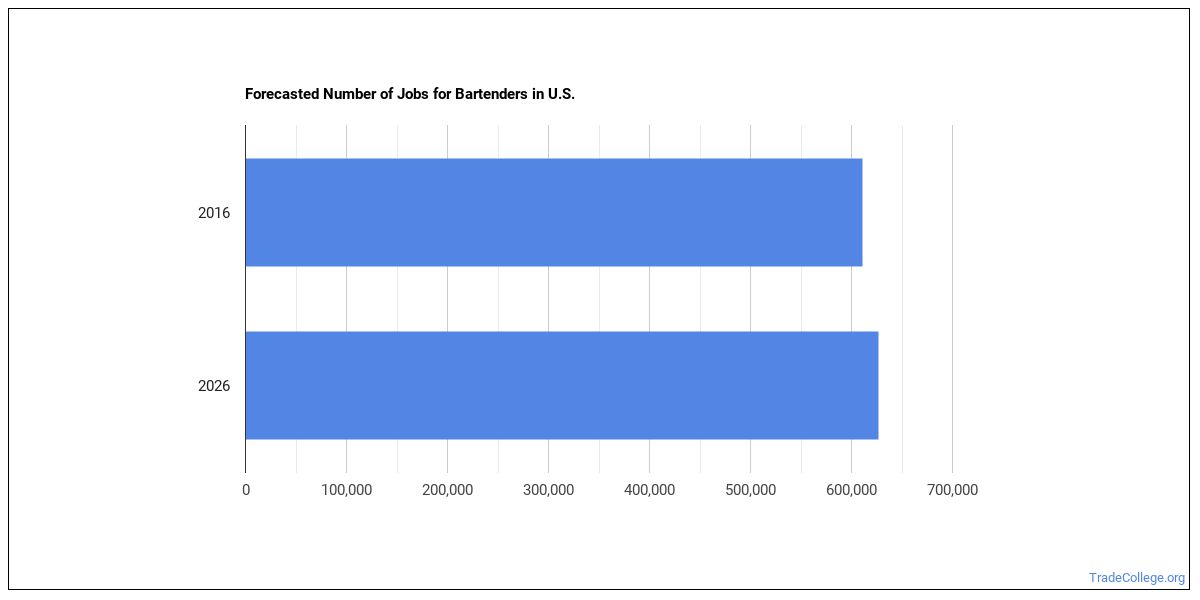
How Many Bartenders Are There?
There are roughly 523,148 bartenders working in the United States today. Employment is projected to grow by +12.2% over the projection horizon.
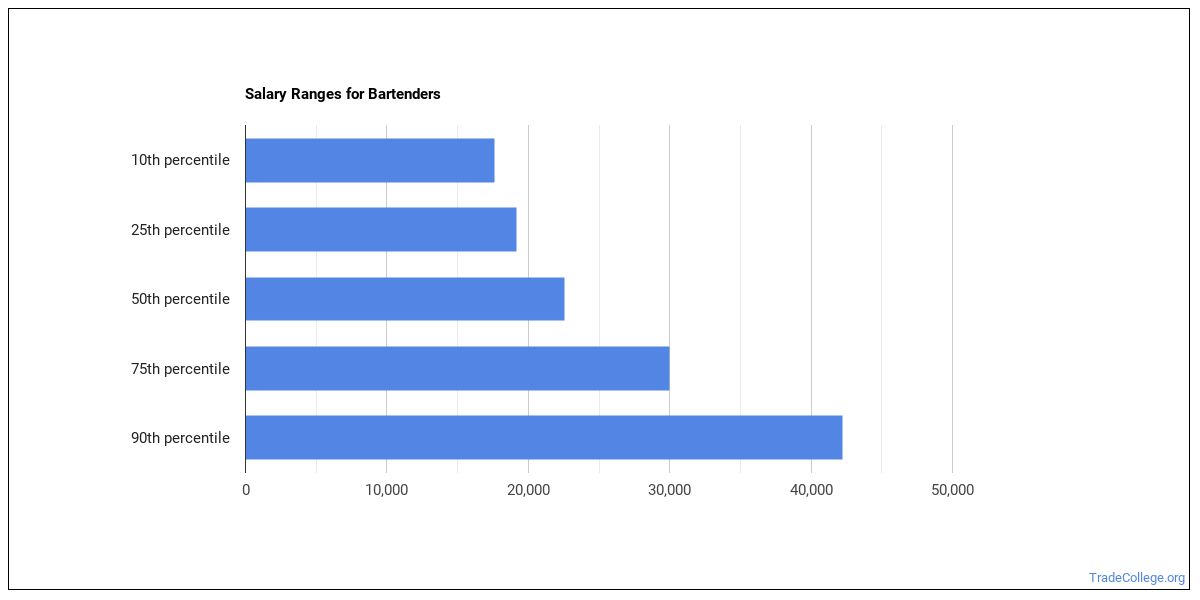
Salary for Bartenders
| Statistic | Value |
|---|---|
| Annual median | $28,151 |
| Hourly median | $13.53 |
| 10th percentile | $20,000 |
| 25th percentile | $23,893 |
| 75th percentile | $32,408 |
| 90th percentile | $36,666 |
Compensation varies based on experience, location, and industry.
Bartenders Salary by State
| State | Annual median salary |
|---|---|
| Hawaii | $68,820 |
| New York | $60,750 |
| District of Columbia | $54,930 |
| Vermont | $54,310 |
| Washington | $48,320 |
| Maine | $47,630 |
| Virginia | $46,860 |
| New Jersey | $45,660 |
| Virgin Islands | $42,630 |
| Arizona | $40,860 |
| Michigan | $39,500 |
| Delaware | $36,420 |
| Massachusetts | $36,000 |
| California | $35,900 |
| Maryland | $35,750 |
| Connecticut | $34,420 |
| Utah | $34,120 |
| Oregon | $33,970 |
| Colorado | $33,780 |
| Rhode Island | $33,700 |
| North Carolina | $32,410 |
| New Mexico | $31,370 |
| Florida | $30,850 |
| Alaska | $29,860 |
| Ohio | $29,850 |
| Nebraska | $29,400 |
| Illinois | $29,120 |
| West Virginia | $29,030 |
| Kentucky | $28,590 |
| South Dakota | $28,530 |
| North Dakota | $28,440 |
| New Hampshire | $28,100 |
| Kansas | $27,760 |
| Texas | $27,750 |
| Pennsylvania | $27,090 |
| Missouri | $27,060 |
| Minnesota | $26,840 |
| Arkansas | $26,030 |
| Nevada | $25,790 |
| Mississippi | $24,700 |
| Georgia | $23,500 |
| Idaho | $22,880 |
| Montana | $22,840 |
| Indiana | $22,790 |
| Alabama | $22,670 |
| Tennessee | $22,660 |
| Wisconsin | $22,520 |
| Iowa | $22,500 |
| Wyoming | $22,010 |
| Oklahoma | $21,620 |
| Puerto Rico | $21,160 |
| Guam | $20,370 |
| Louisiana | $19,620 |
| South Carolina | $18,390 |
Pay by U.S. Region
Earnings for bartenders differ across the country. Top regions by median wage:
| Region | Median annual wage | Share of U.S. jobs | Location quotient |
|---|---|---|---|
| Middle Atlantic | $44,657 | 15.5% | 1.03 |
| Far Western US | $37,106 | 16.5% | 1.12 |
| New England | $36,583 | 5.6% | 1.19 |
| Rocky Mountains | $29,800 | 4.4% | 1.33 |
| Southwest | $29,659 | 10.7% | 0.85 |
| Southeast | $29,241 | 20.9% | 0.91 |
| Great Lakes | $28,718 | 17.3% | 1.34 |
| Plains States | $26,830 | 8.6% | 1.31 |
Top Metro Areas
| Metro area | State | Median annual wage | Employment |
|---|---|---|---|
| Kahului-Wailuku, HI | HI | $80,040 | 780 |
| Urban Honolulu, HI | HI | $70,300 | 2,210 |
| Burlington-South Burlington, VT | VT | $65,480 | 850 |
| New York-Newark-Jersey City, NY-NJ | NY | $59,030 | 37,530 |
| Kingston, NY | NY | $56,070 | 480 |
| Kiryas Joel-Poughkeepsie-Newburgh, NY | NY | $51,390 | 1,290 |
| Portland-South Portland, ME | ME | $51,180 | 1,760 |
| Washington-Arlington-Alexandria, DC-VA-MD-WV | DC | $50,070 | 15,110 |
Top Industries Employing Bartenders
The largest employers of bartenders are found across these industries:
| Industry | Employment | Median annual wage |
|---|---|---|
| Accommodation and Food Services | 588,740 | $34,020 |
| Arts, Entertainment, and Recreation | 55,000 | $31,950 |
| Other Services (except Public Administration) | 42,310 | $27,580 |
| Manufacturing | 38,190 | $35,030 |
| Retail Trade | 5,600 | $34,080 |
| Administrative and Support and Waste Management and Remediation Services | 4,530 | $39,970 |
| Real Estate and Rental and Leasing | 3,290 | $31,760 |
| Information | 2,750 | $32,160 |

The table below shows some of the most common industries where those employed in this career field work.

Software Bartenders Use
- Web page creation and editing software: Facebook (hot technology)
- Electronic mail software: Microsoft Outlook (hot technology)
The Day-to-Day Environment
Daily working conditions for bartenders reflects the following characteristics:
- Contact With Others
- Spend Time Standing
- Deal With External Customers or the Public in General
- Face-to-Face Discussions with Individuals and Within Teams
- Physical Proximity
Getting Started in This Career
Most bartenders positions require a high school diploma or equivalent as the typical entry-level education. The role falls in Some Preparation Needed (Job Zone 2), signaling the level of preparation typically expected.
Similar Occupations
Similar Occupations
- Food Service Managers (Primary-Long)
- Chefs and Head Cooks (Primary-Long)
- First-Line Supervisors of Food Preparation and Serving Workers (Primary-Long)
- Cooks, Fast Food (Supplemental)
- Cooks, Institution and Cafeteria (Supplemental)
- Cooks, Private Household (Supplemental)
- Cooks, Restaurant (Primary-Long)
- Cooks, Short Order (Primary-Long)
Where to Study
Future bartenders commonly pursue programs in:
Personal and Culinary Services
1 programs across 1 majors
About the Data
Data on this page comes from the following authoritative sources:
- U.S. Bureau of Labor Statistics — Occupational Employment and Wage Statistics (OEWS) for employment and wage data by state and industry.
- BLS Employment Projections for total employment and growth forecasts.
- O*NET (Occupational Information Network) for skills, knowledge, tasks, work activities, work context, technology, and education-zone data.
SOC code: 35-3011.00 (Bartenders).
TradeCollege.org provides higher-education, college and university, degree, program, career, salary, and other helpful information to students, faculty, institutions, and other internet audiences. Presented information and data are subject to change. Inclusion on this website does not imply or represent a direct relationship with the company, school, or brand. Information, though believed correct at time of publication, may not be correct, and no warranty is provided. Contact the schools to verify any information before relying on it. Financial aid may be available for those who qualify. TradeCollege.org is a for-profit site, and the displayed options may include sponsored or recommended results, not necessarily based on your preferences.
© TradeCollege.org – All Rights Reserved.