Other Corrections & Criminal Justice Schools in District of Columbia
7 Other Corrections & Criminal Justice students earned their degrees in the state in 2021-2022.
Featured schools near , edit
Education Levels of Other Corrections & Criminal Justice Majors in District of Columbia
Other Corrections & Criminal Justice majors in the state tend to have the following degree levels:
| Education Level | Number of Grads |
|---|---|
| Bachelor’s Degree | 7 |
Gender Distribution
In District of Columbia, a other corrections & criminal justice major is more popular with women than with men.

Racial Distribution
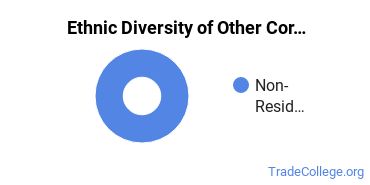
The racial distribution of other corrections & criminal justice majors in District of Columbia is as follows:
- Asian: 0.0%
- Black or African American: 14.3%
- Hispanic or Latino: 0.0%
- White: 85.7%
- Non-Resident Alien: 0.0%
- Other Races: 0.0%

Jobs for Other Corrections & Criminal Justice Grads in District of Columbia
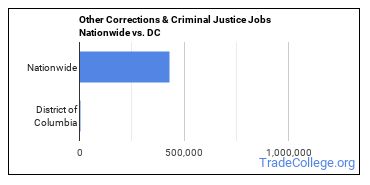
There are 90 people in the state and 429,890 people in the nation working in other corrections & criminal justice jobs.

Wages for Other Corrections & Criminal Justice Jobs in District of Columbia
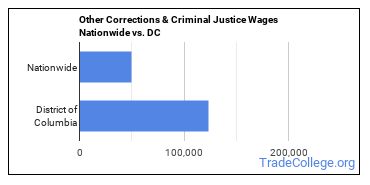
Other Corrections & Criminal Justice grads earn an average of $123,320 in the state and $49,300 nationwide.

Other Corrections & Criminal Justice Careers in DC
Some of the careers other corrections & criminal justice majors go into include:
| Job Title | DC Job Growth | DC Median Salary |
|---|
Explore Major by State
Alabama
Arkansas
Connecticut
Florida
Idaho
Iowa
Louisiana
Massachusetts
Mississippi
Nebraska
New Jersey
North Carolina
Oklahoma
Rhode Island
Tennessee
Vermont
West Virginia
View Nationwide Other Corrections & Criminal Justice Report
References
More about our data sources and methodologies.
Featured Schools
 Request Info
|
Southern New Hampshire University You have goals. Southern New Hampshire University can help you get there. Whether you need a bachelor's degree to get into a career or want a master's degree to move up in your current career, SNHU has an online program for you. Find your degree from over 200 online programs. Learn More > |
