Find Trade Colleges
Life As an Insurance Claims and Policy Processing Clerk
Career Description Process new insurance policies, modifications to existing policies, and claims forms. Obtain information from policyholders to verify the accuracy and completeness of information on claims forms, applications and related documents, and company records. Update existing policies and company records to reflect changes requested by policyholders and insurance company representatives.
Featured schools near , edit
Types of Insurance Claims and Policy Processing Clerk
- Insurance Clerk
- Insurance Claims Clerk
- Underwriting Clerk
- Insurance Examining Clerk
- Billing and Insurance Coordinator
Insurance Claims & Policy Processing Clerk Job Outlook
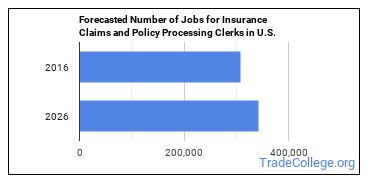
In 2016, there was an estimated number of 308,500 jobs in the United States for Insurance Claims and Policy Processing Clerk. New jobs are being produced at a rate of 11.1% which is above the national average. The Bureau of Labor Statistics predicts 34,100 new jobs for Insurance Claims and Policy Processing Clerk by 2026. Due to new job openings and attrition, there will be an average of 35,600 job openings in this field each year.

The states with the most job growth for Insurance Claims & Policy Processing Clerk are Utah, Arizona, and Iowa. Watch out if you plan on working in Maine, Vermont, or Oregon. These states have the worst job growth for this type of profession.
Do Insurance Claims and Policy Processing Clerks Make A Lot Of Money?
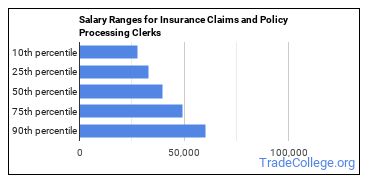
The salary for Insurance Claims and Policy Processing Clerks ranges between about $27,540 and $60,500 a year.

Insurance Claims and Policy Processing Clerks who work in District of Columbia, Connecticut, or Massachusetts, make the highest salaries.
How much do Insurance Claims and Policy Processing Clerks make in each U.S. state?
| State | Annual Mean Salary |
|---|---|
| Alabama | $37,000 |
| Alaska | $42,450 |
| Arizona | $42,760 |
| Arkansas | $35,960 |
| California | $42,690 |
| Colorado | $48,700 |
| Connecticut | $50,300 |
| Delaware | $40,540 |
| District of Columbia | $56,710 |
| Florida | $39,150 |
| Georgia | $46,190 |
| Hawaii | $40,270 |
| Idaho | $40,410 |
| Illinois | $43,540 |
| Indiana | $39,740 |
| Iowa | $43,500 |
| Kansas | $40,350 |
| Kentucky | $34,370 |
| Louisiana | $35,100 |
| Maine | $40,180 |
| Maryland | $47,600 |
| Massachusetts | $48,820 |
| Michigan | $38,310 |
| Minnesota | $44,700 |
| Mississippi | $33,420 |
| Missouri | $40,100 |
| Montana | $39,020 |
| Nebraska | $39,410 |
| Nevada | $40,700 |
| New Hampshire | $44,500 |
| New Jersey | $47,180 |
| New Mexico | $37,360 |
| New York | $48,740 |
| North Carolina | $43,180 |
| North Dakota | $41,610 |
| Ohio | $39,830 |
| Oklahoma | $42,120 |
| Oregon | $43,950 |
| Pennsylvania | $42,590 |
| Rhode Island | $45,300 |
| South Carolina | $36,850 |
| South Dakota | $33,540 |
| Tennessee | $37,880 |
| Texas | $39,950 |
| Utah | $40,940 |
| Vermont | $41,420 |
| Virginia | $42,030 |
| Washington | $45,810 |
| West Virginia | $33,710 |
| Wisconsin | $40,340 |
| Wyoming | $36,190 |
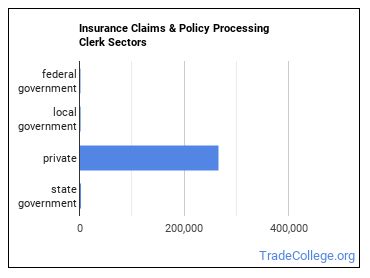
Who Employs Insurance Claims and Policy Processing Clerks?

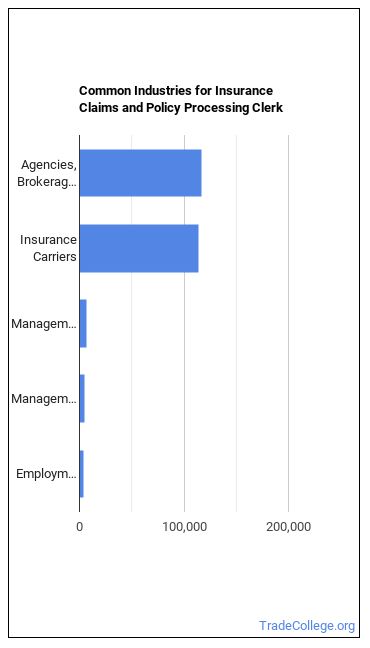
Insurance Claims and Policy Processing Clerks work in the following industries:

References:
More about our data sources and methodologies.
