Find Trade Colleges
Ironworking
Types of Degrees Ironworking Majors Are Earning
Those studying Ironworking can earn degrees at several award levels.
| Award Level | Graduates |
|---|---|
| Certificate | 123 |
| Associate’s Degree | 37 |
| Master’s Degree | 1 |
What Ironworking Majors Need to Know
Coursework for Ironworking develop a specific mix of knowledge, skills, and abilities — derived from O*NET surveys of workers in occupations that Ironworking graduates commonly enter.
Knowledge Areas
This major prepares you for careers needing Ironworking emphasizes the following knowledge areas:

- English Language — Importance 3.4 / 5; level 2.9 / 7.
- Mechanical — Importance 3.4 / 5; level 4.0 / 7.
- Production and Processing — Importance 3.3 / 5; level 3.9 / 7.
- Education and Training — Importance 3.3 / 5; level 4.0 / 7.
- Administration and Management — Importance 3.2 / 5; level 3.0 / 7.
Importance is rated 1–5; level is 1–7. Source: ONET Online — weighted across related occupations.*
Skills
The skill set emphasized by a Ironworking program reflects the day-to-day work of related occupations:

- Operations Monitoring — Importance 3 / 5; level 2.4 / 7.
- Monitoring — Importance 3 / 5; level 2.6 / 7.
- Active Listening — Importance 2.9 / 5; level 2.2 / 7.
- Time Management — Importance 2.9 / 5; level 2.5 / 7.
- Critical Thinking — Importance 2.9 / 5; level 2.5 / 7.
Abilities
Abilities most relevant to Ironworking careers — again drawn from O*NET surveys of related occupations:
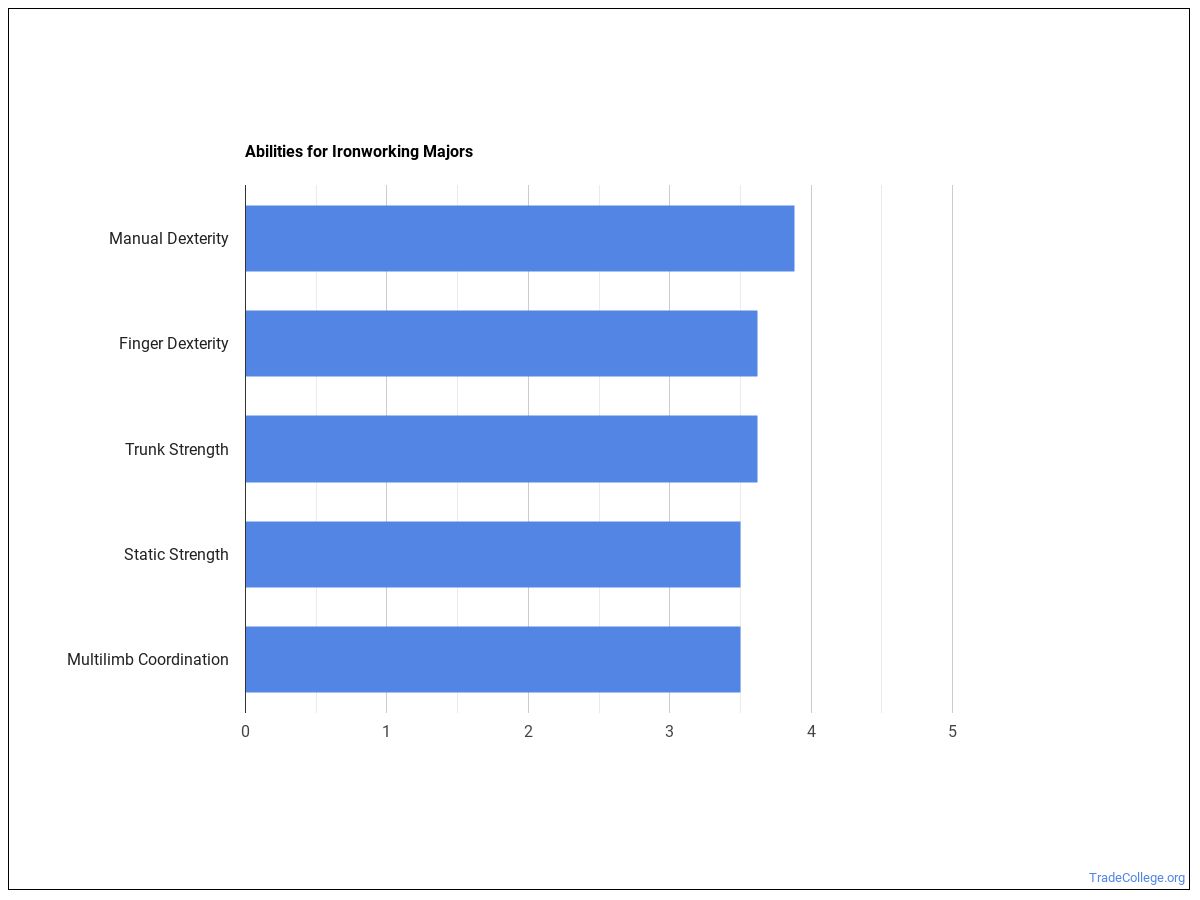
- Trunk Strength — Importance 3.8 / 5; level 3.1 / 7.
- Manual Dexterity — Importance 3.6 / 5; level 3.6 / 7.
- Arm-Hand Steadiness — Importance 3.5 / 5; level 3.1 / 7.
- Static Strength — Importance 3.5 / 5; level 3.5 / 7.
- Finger Dexterity — Importance 3.4 / 5; level 3 / 7.
Common Job Activities
Day-to-day, Ironworking graduates report doing:
| Activity | Frequency / Importance |
|---|---|
| Handling and Moving Objects | 4.4 / 7 |
| Performing General Physical Activities | 4.3 / 7 |
| Monitoring Processes, Materials, or Surroundings | 3.8 / 7 |
| Inspecting Equipment, Structures, or Materials | 3.8 / 7 |
| Getting Information | 3.7 / 7 |
| Identifying Objects, Actions, and Events | 3.7 / 7 |
| Communicating with Supervisors, Peers, or Subordinates | 3.6 / 7 |
| Judging the Qualities of Objects, Services, or People | 3.5 / 7 |
| Controlling Machines and Processes | 3.5 / 7 |
| Evaluating Information to Determine Compliance with Standards | 3.3 / 7 |
Technology Skills Used on the Job
Most frequently-cited tools used by Ironworking professionals:
| Tool / Software | Category | In-Demand |
|---|---|---|
| PTC Creo Parametric | Computer aided design CAD software | — |
| Dassault Systemes SolidWorks | Computer aided design CAD software | — |
| Inventory tracking software | Inventory management software | — |
| Machine control software | Industrial control software | — |
| Computer aided manufacturing CAM software | Computer aided manufacturing CAM software | — |
| CNC Software Mastercam | Computer aided manufacturing CAM software | — |
| Autodesk AutoCAD | Computer aided design CAD software | — |
Source: ONET Online technology skills, weighted across related occupations.*
Sample Job Titles
Real job postings for Ironworking graduates include:
- Bond Runner
- Wax Pattern Coater
- Sand Molder
- Core Maker
- Foundry Tender
- Core Stripper
- Green Sand Molder
- Core Oven Tender
- Airset Caster
- Sweep Molder
- Foundry Worker
- Dry Molder
- Core Microarchitect
- No Bake Molder
- Core Machine Operator
Education Typically Required
Across the occupations open to Ironworking graduates, the typical level of education actually held by current workers is distributed as:
| Education Level | Share of Workers |
|---|---|
| High school diploma or equivalent | 64.4% |
| Less than a high school diploma | 35.6% |
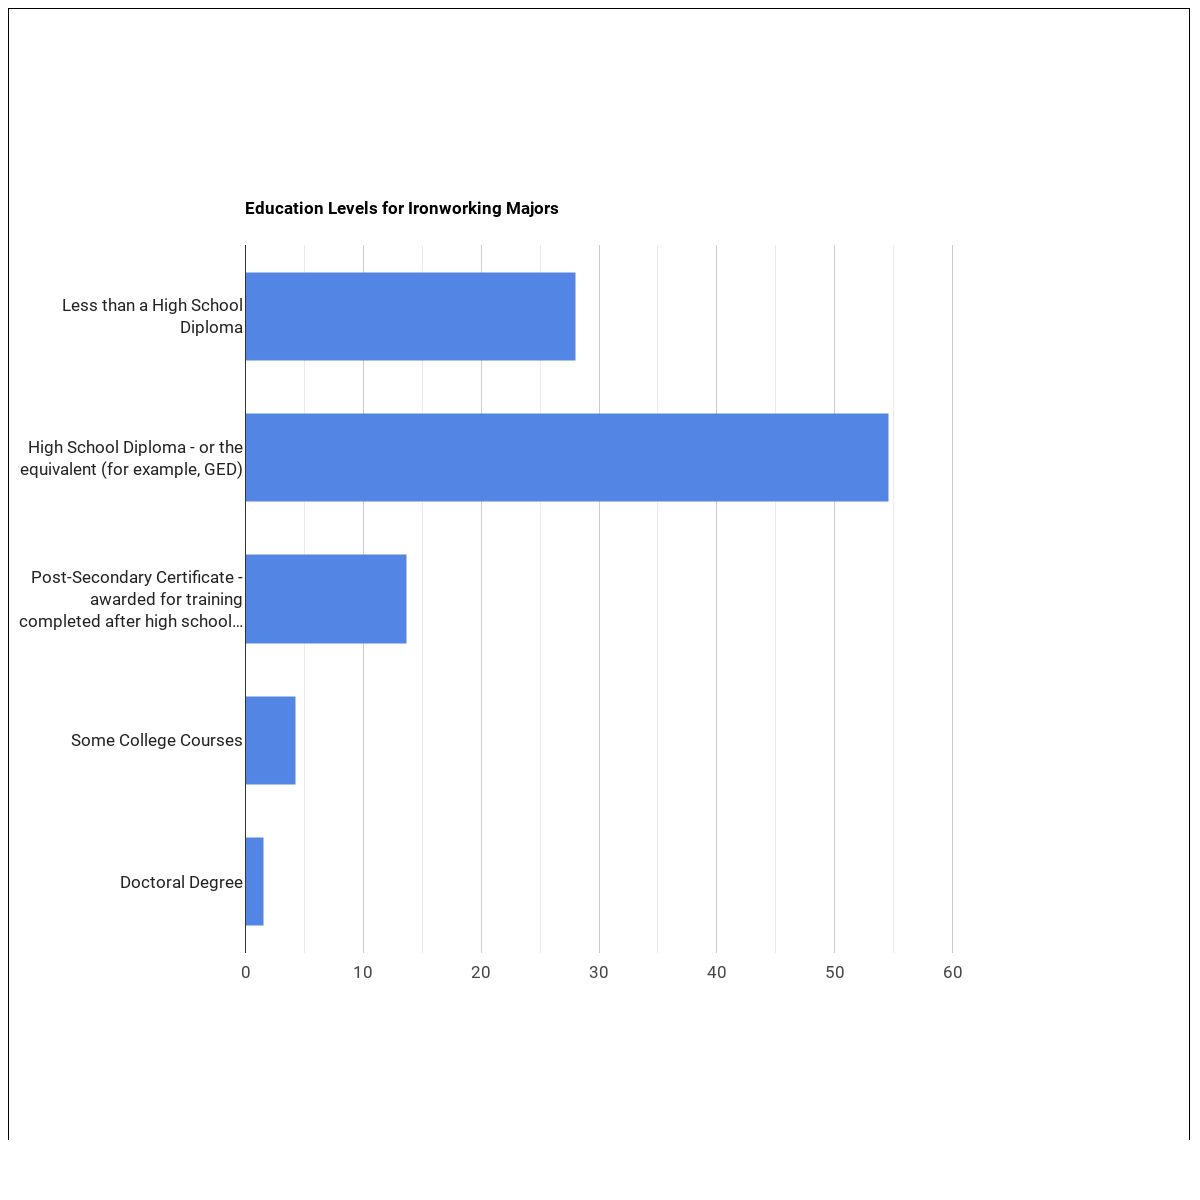
Source: ONET Online education / training / experience requirements.*
Who Is Earning a Degree in Ironworking?
Gender Distribution
This field skews predominantly male, with men earning 98.8% of Ironworking degrees.
| Gender | Graduates | Share |
|---|---|---|
| Women | 2 | 1.2% |
| Men | 159 | 98.8% |
Racial-Ethnic Diversity
At the national level, the racial-ethnic distribution of Ironworking graduates is as follows:

| Race / Ethnicity | Graduates | Share |
|---|---|---|
| White | 107 | 66.5% |
| Hispanic or Latino | 10 | 6.2% |
| Black or African American | 8 | 5.0% |
| Native Hawaiian / Pacific Islander | 1 | 0.6% |
| Race Unknown | 35 | 21.7% |
See minority definition below.
How Much Do Ironworking Graduates Earn?
Federal data tracks median earnings of Ironworking graduates 1, 4, and 5 years after completion. Earnings tend to climb steadily as graduates gain experience and move into mid-career roles.
| Years Out | Median Earnings |
|---|---|
| 1 year | $33,800 |
| 4 years | $39,416 |
| 5 years | $44,203 |
By year 5 out, median earnings rise to $44,203 — roughly 31% above the 1-year mark.
Source: U.S. Department of Education College Scorecard, field-of-study earnings tracker.
Is a Degree in Ironworking Worth It?
Strictly by the federal earnings tracker, Ironworking graduates earn a median of $39,416 four years after completion — roughly 4% above the national median for workers with only a high school diploma (~$38,000).

ROI estimate compares the program’s 4-yr median earnings against the 2023 BLS CPS median earnings for high-school-only workers. Source: U.S. Department of Education College Scorecard + BLS Current Population Survey.
Related Programs
You may also be interested in these closely related fields of study:
| Program | Annual Degrees Awarded |
|---|---|
| Precision Metal Working | 67,063 |
| Welding Technology/Welder | 57,768 |
| Machine Tool Technology/Machinist | 3,539 |
| Computer Numerically Controlled (CNC) Machinist Technology/CNC Machinist | 2,174 |
| Machine Shop Technology/Assistant | 1,634 |
| Metal Fabricator | 552 |
| Tool and Die Technology/Technician | 509 |
| Sheet Metal Technology/Sheetworking | 386 |
| Precision Metal Working, Other | 340 |
Explore Ironworking by State
Alabama
California
District of Columbia
Idaho
Kansas
Maryland
Mississippi
Nevada
New York
Oklahoma
South Carolina
Utah
West Virginia
Alaska
Colorado
Florida
Illinois
Kentucky
Massachusetts
Missouri
New Hampshire
North Carolina
Oregon
South Dakota
Vermont
Wisconsin
References
The racial-ethnic minorities count is calculated by taking the total number of students and subtracting white students and international students. This number is then divided by the total number of students to obtain the racial-ethnic minorities percentage.
- College Factual
- National Center for Education Statistics (IPEDS)
- O*NET Online
- U.S. Bureau of Labor Statistics
- U.S. Department of Education College Scorecard
More about our data sources and methodologies.
TradeCollege.org provides higher-education, college and university, degree, program, career, salary, and other helpful information to students, faculty, institutions, and other internet audiences. Presented information and data are subject to change. Inclusion on this website does not imply or represent a direct relationship with the company, school, or brand. Information, though believed correct at time of publication, may not be correct, and no warranty is provided. Contact the schools to verify any information before relying on it. Financial aid may be available for those who qualify. TradeCollege.org is a for-profit site, and the displayed options may include sponsored or recommended results, not necessarily based on your preferences.
© TradeCollege.org – All Rights Reserved.