Find Trade Colleges
Mental & Social Health Services Schools in District of Columbia
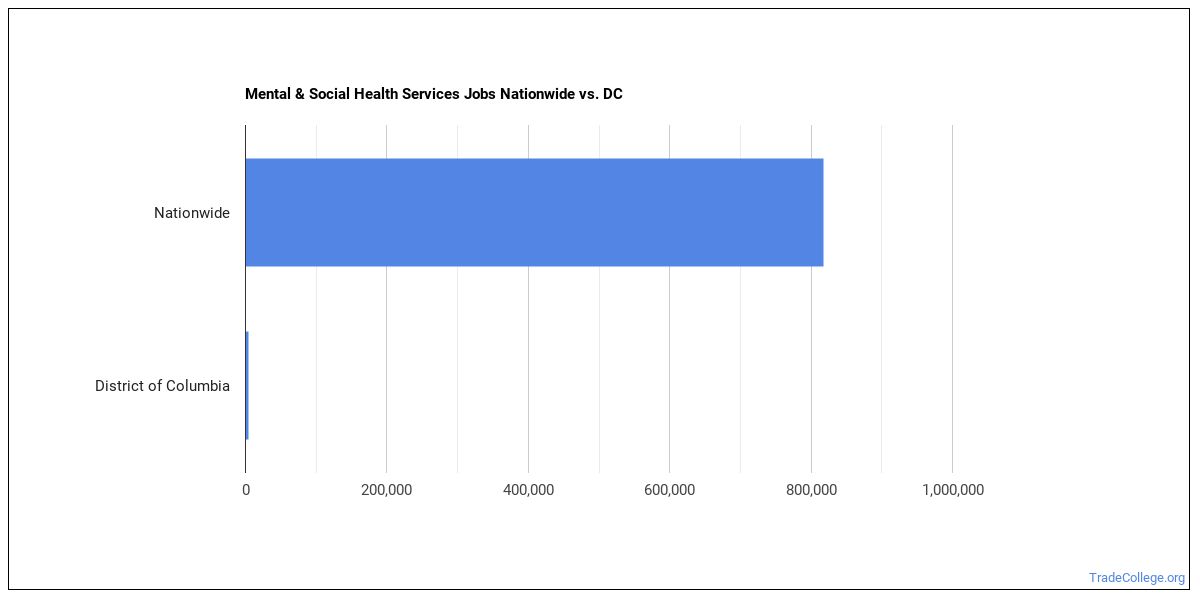
Jobs for Mental & Social Health Services Grads in District of Columbia
There are 8,240 people in the state and 1,595,960 people in the nation working in Mental Health Services jobs.
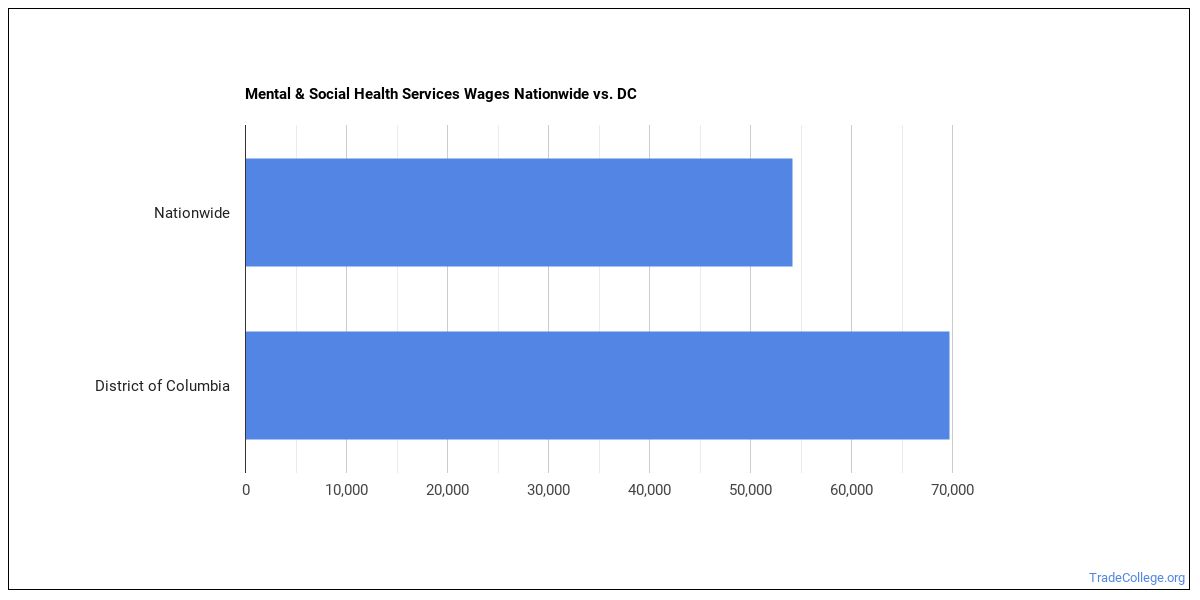
Wages for Mental & Social Health Services Jobs in District of Columbia
Mental Health Services grads earn an average of $98,044 in the state and $77,335 nationwide.
Mental & Social Health Services Careers in DC
Some of the careers Mental Health Services majors go into include:
| Job Title | Nationwide Job Growth | Nationwide Median Salary |
|---|---|---|
| Clinical and Counseling Psychologists | 15% | $68,140 |
| Genetic Counselors | 13% | $58,726 |
| Community Health Workers | 13% | $73,901 |
| Psychiatric Technicians | 12% | $52,472 |
| Healthcare Social Workers | 12% | $78,044 |
| Health Specialties Teachers, Postsecondary | 11% | $46,663 |
| Social Work Teachers, Postsecondary | 8% | $65,510 |
| Mental Health and Substance Abuse Social Workers | 6% | $58,560 |
| Social Workers, All Other | 5% | $62,827 |
| Counselors, All Other | 5% | $81,766 |
| Health Education Specialists | 4% | $81,726 |
| Psychiatric Aides | 4% | $51,090 |
Related Majors in District of Columbia
Below are some popular majors that are similar to Mental Health Services.
| Major | Annual Graduates Nationwide |
|---|---|
| Nursing | 311,372 |
| Nursing & Nursing Assistants | 99,987 |
| Allied Health Professions | 90,379 |
| Health/Medical Admin Services | 90,166 |
| Allied Health Services | 80,693 |
| Public Health | 41,086 |
| Health Sciences & Services | 38,201 |
| Medicine | 29,737 |
View all majors related to Mental & Social Health Services
Explore Major by State
Alabama
Arkansas
Connecticut
Florida
Hawaii
Indiana
Kentucky
Maryland
Minnesota
Montana
New Hampshire
New York
Ohio
Pennsylvania
South Carolina
Texas
Virgin Islands
West Virginia
View Nationwide Mental & Social Health Services Report
References
More about our data sources and methodologies.
TradeCollege.org provides higher-education, college and university, degree, program, career, salary, and other helpful information to students, faculty, institutions, and other internet audiences. Presented information and data are subject to change. Inclusion on this website does not imply or represent a direct relationship with the company, school, or brand. Information, though believed correct at time of publication, may not be correct, and no warranty is provided. Contact the schools to verify any information before relying on it. Financial aid may be available for those who qualify. TradeCollege.org is a for-profit site, and the displayed options may include sponsored or recommended results, not necessarily based on your preferences.
© TradeCollege.org – All Rights Reserved.