Find Trade Colleges
Mechanical Engineering at Butler County Community College
What traits are you looking for in a school for Mechanical Engineering, you may want to check out the program at Butler County Community College. Get started with the following essential facts.
Butler County Community College is in Butler, PA.
During the most recent reporting year, 3 mechanical engineering graduations were recorded at Butler County Community College.
Online & Distance Learning at Butler County Community College
Many students take online classes at Butler County Community College. Among 2,317 students, 325 (14%) studied exclusively online and 594 (26%) took at least some classes online.
Student Demographics & Diversity
Below you’ll find the composition of Mechanical Engineering graduates at Butler County Community College, by degree type.
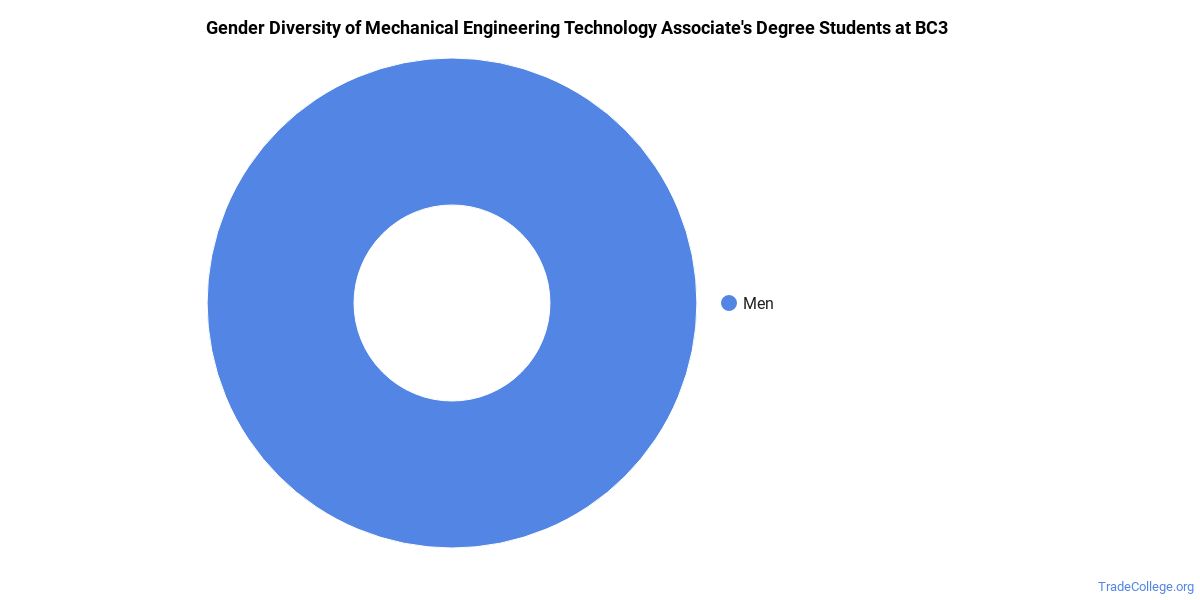
Across all degree levels, Mechanical Engineering graduates at Butler County Community College are 67% women (2) and 33% men (1).
Mechanical Engineering Associate’s Program at Butler County Community College
Among the 3 associate’s mechanical engineering graduates at Butler County Community College, 67% were women (2) and 33% were men (1).
The following table and chart show the race/ethnicity of Mechanical Engineering associate’s degree recipients at Butler County Community College.
| Race / Ethnicity | Number of Graduates |
|---|---|
| White | 3 |
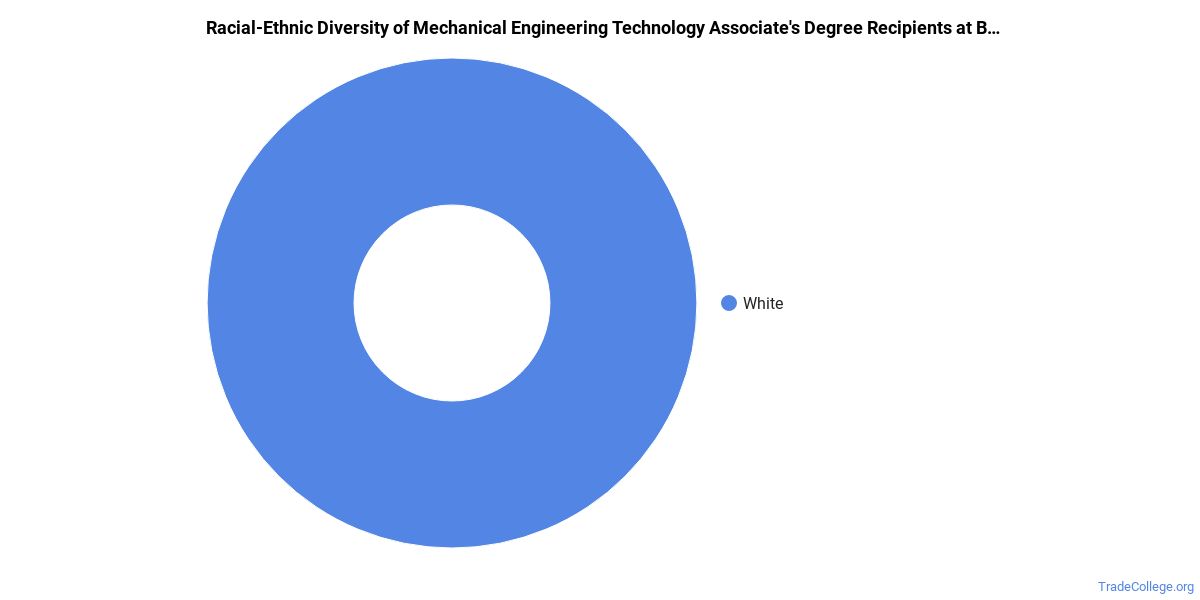
*The racial-ethnic minorities figure is the total number of graduates minus White, international (nonresident), and unknown-race graduates.
More Specific Mechanical Engineering Concentrations at Butler County Community College
The Mechanical Engineering program at Butler County Community College breaks down into more specific concentrations:
| Concentration | Graduates |
|---|---|
| Mechanical Engineering Technology | 3 |
Highest-Paying Careers for Mechanical Engineering Graduates
Students who finish Mechanical Engineering program at Butler County Community College work across a variety of fields. The table below ranks the highest-paying careers for Mechanical Engineering graduates, ordered by median annual salary:
| Occupation | Nationwide Median Wage |
|---|---|
| Electro-Mechanical and Mechatronics Technologists and Technicians | $134,632 |
| Robotics Technicians | $131,252 |
| Engineering Technologists and Technicians, Except Drafters, All Other | $121,642 |
| Mechanical Engineering Technologists and Technicians | $108,923 |
| Photonics Technicians | $106,964 |
| Automotive Engineering Technicians | $89,794 |
| Mechanical Drafters | $78,252 |
| Aerospace Engineering and Operations Technologists and Technicians | $77,835 |
| Non-Destructive Testing Specialists | $57,631 |
| Motorboat Mechanics and Service Technicians | $50,761 |
References
- IPEDS — Integrated Postsecondary Education Data System
- U.S. Department of Education — College Scorecard
- O*NET Online (Bureau of Labor Statistics)
- National Center for Education Statistics
More about our data sources and methodologies.
TradeCollege.org provides higher-education, college and university, degree, program, career, salary, and other helpful information to students, faculty, institutions, and other internet audiences. Presented information and data are subject to change. Inclusion on this website does not imply or represent a direct relationship with the company, school, or brand. Information, though believed correct at time of publication, may not be correct, and no warranty is provided. Contact the schools to verify any information before relying on it. Financial aid may be available for those who qualify. TradeCollege.org is a for-profit site, and the displayed options may include sponsored or recommended results, not necessarily based on your preferences.
© TradeCollege.org – All Rights Reserved.