Find Trade Colleges
Machine Tool Operators in California
Want to work in California as a Machine Tool Operator? Read this first!
You’re in luck! Jobs for Machine Tool Operators in California are projected to grow and these jobs tend to pay higher than average.
-
Projected employment for Machine Tool Operators in California is growing slower than average.
-
Machine Tool Operators in California earn lower salaries than the typical U.S. wage earner.
Featured schools near , edit
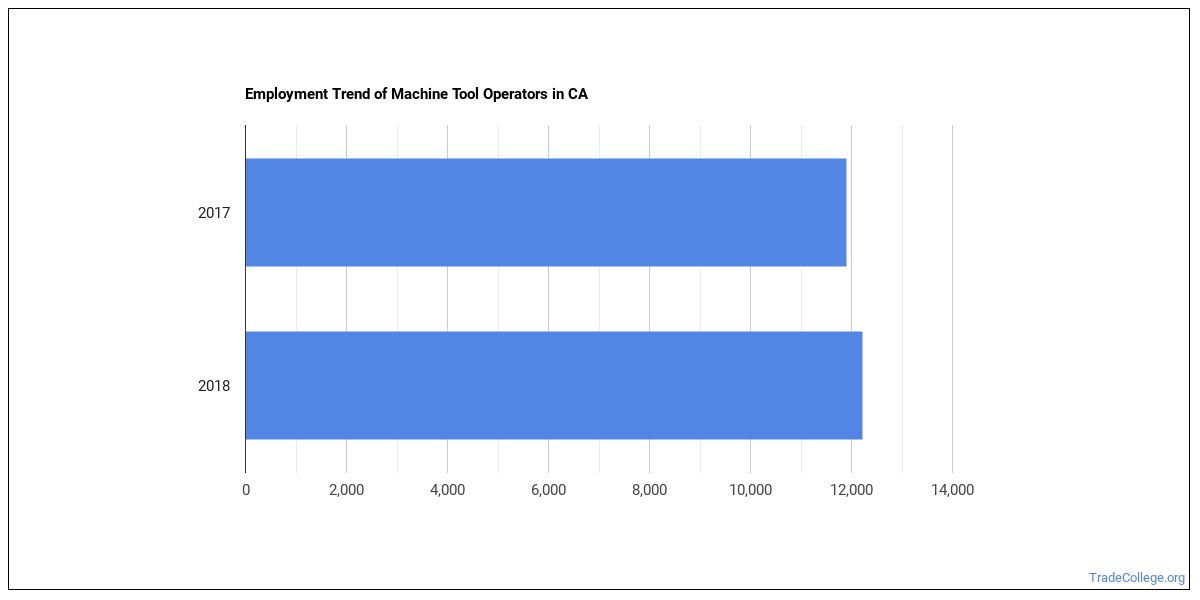
How Many Machine Tool Operators Work in California?
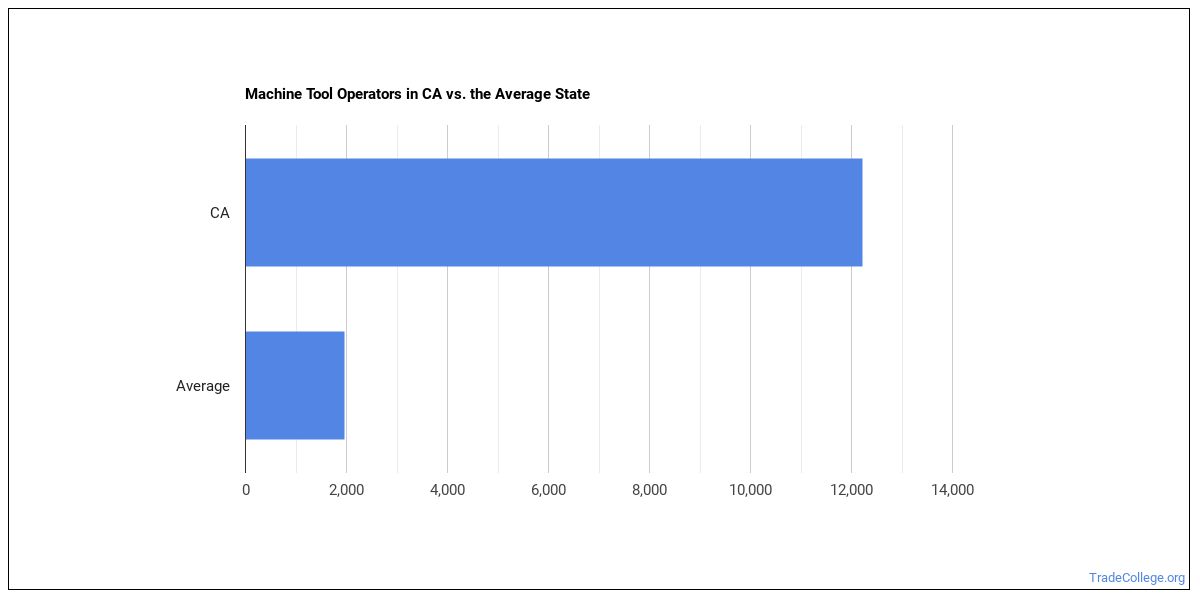
In California, there were 12,220 people working as Machine Tool Operators in the year 2018.
There were 11,910 Machine Tool Operators employed in this state in 2017.
That’s growth of 310 jobs between 2017 and 2018.
The typical state has 1,970 Machine Tool Operators working in it, which means California has more Machine Tool Operators than average.
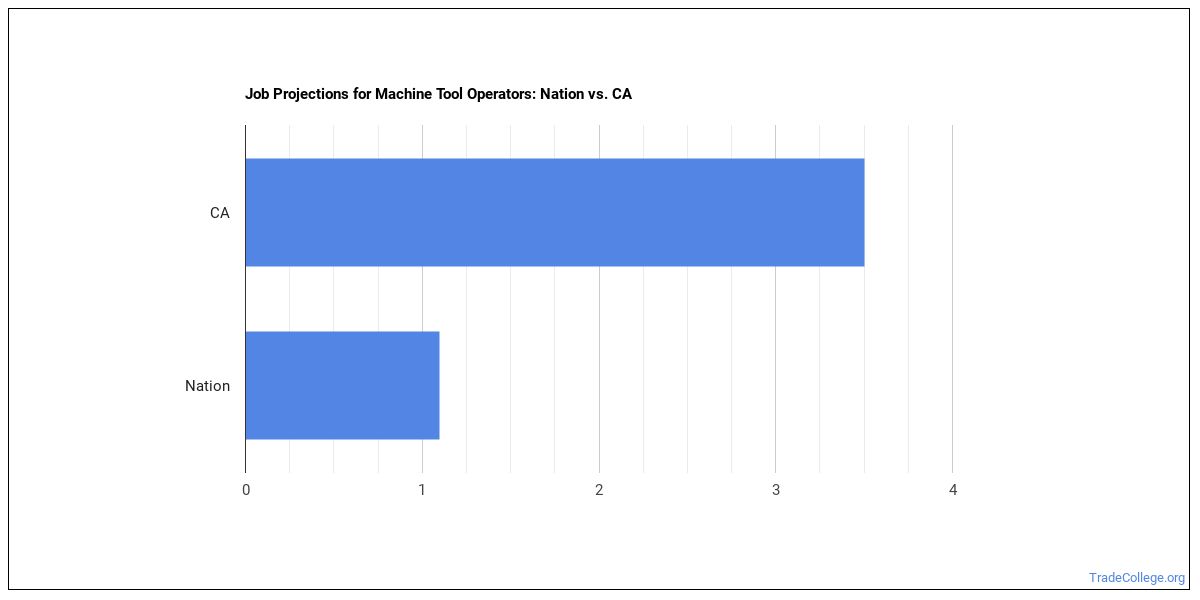
Job Projections for California
Jobs for Machine Tool Operators in this state are growing at a rate of 3.5% which is faster than the nationwide estimated projection of 1.1%.
California Annual Job Openings
The BLS estimates there will be 1,190 annual job openings, and 11,900 total jobs in 2026 for Machine Tool Operators in this state.
Nationwide, the prediction is 14,500 annual jobs and 147,300 total jobs in 2026.
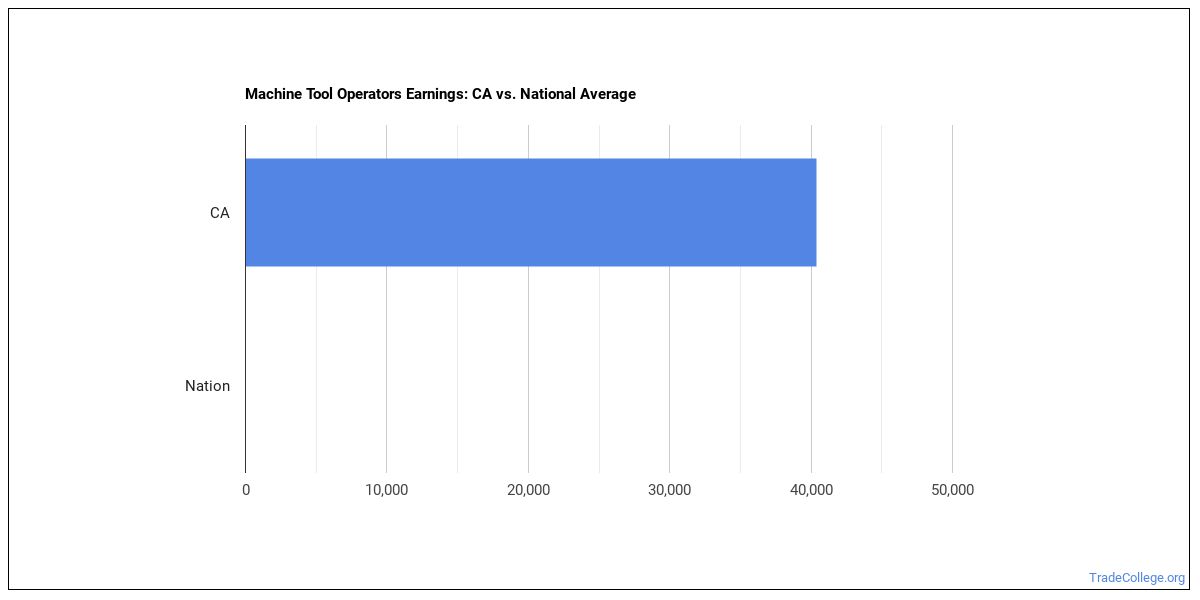
What do Machine Tool Operators Make in California?
In 2018 wages for Machine Tool Operators ranged from $26,140 to $63,570 with $40,380 being the median annual salary.
Broken down to an hourly rate, workers in this field made anywhere from $12.57 to $30.56. The median hourly rate was $19.41.
Workers in this field were paid a median of $18.83 an hour in 2017.
The hourly rate grew by $0.58.
The median salary in California is higher than the nationwide median salary.
Top California Metros for Machine Tool Operators
The table below shows some of the metros in this state with the most Machine Tool Operators.
| Metro | Number Employed | Annual Median Salary |
|---|---|---|
| Los Angeles-Long Beach-Anaheim, CA | 6,490 | $39,120 |
| San Diego-Carlsbad, CA | 1,320 | $44,850 |
| San Jose-Sunnyvale-Santa Clara, CA | 990 | $42,780 |
| Riverside-San Bernardino-Ontario, CA | 920 | $37,260 |
| San Francisco-Oakland-Hayward, CA | 800 | $39,800 |
| Oxnard-Thousand Oaks-Ventura, CA | 360 | $49,520 |
| Sacramento–Roseville–Arden-Arcade, CA | 260 | $44,870 |
| Vallejo-Fairfield, CA | 190 | $41,010 |
| Fresno, CA | 110 | $39,590 |
| Stockton-Lodi, CA | 110 | $44,050 |
| Modesto, CA | 50 | $38,230 |
| Chico, CA | 30 | $39,210 |
| Visalia-Porterville, CA | 30 | $37,310 |
Top States for Machine Tool Operators Employment
View the list below to see where most Machine Tool Operators work.
| State | Number Employed | Annual Median Salary |
|---|---|---|
| Ohio | 13,910 | $40,400 |
| Pennsylvania | 12,280 | $38,800 |
| California | 12,220 | $40,380 |
| Wisconsin | 11,540 | $43,720 |
| Texas | 11,040 | $39,800 |
| Michigan | 8,370 | $39,320 |
| Indiana | 6,890 | $38,000 |
| Illinois | 5,360 | $37,330 |
| Missouri | 4,940 | $38,180 |
| New York | 4,630 | $37,740 |
| North Carolina | 4,050 | $37,890 |
| Minnesota | 3,310 | $44,080 |
| Oklahoma | 3,140 | $38,310 |
| New Hampshire | 3,090 | $43,000 |
| South Carolina | 2,880 | $43,530 |
| Connecticut | 2,830 | $47,400 |
| Florida | 2,480 | $37,270 |
| Tennessee | 2,450 | $37,460 |
| New Jersey | 2,430 | $44,850 |
| Massachusetts | 2,420 | $49,790 |
Below are the states where Machine Tool Operators get paid the most:
| State | Annual Median Salary |
|---|---|
| Washington | $59,100 |
| Massachusetts | $49,790 |
| North Dakota | $47,870 |
| Connecticut | $47,400 |
| Maine | $47,050 |
| New Jersey | $44,850 |
| Maryland | $44,480 |
| West Virginia | $44,270 |
| Minnesota | $44,080 |
| Louisiana | $43,910 |
Related Careers in CA
You may also be interested in the following careers:
| Occupation | CA Employment Total |
|---|
References
- Bureau of Labor Statistics (BLS)
- College Factual
- National Center for Education Statistics
- O*NET Online
More about our data sources and methodologies.
TradeCollege.org provides higher-education, college and university, degree, program, career, salary, and other helpful information to students, faculty, institutions, and other internet audiences. Presented information and data are subject to change. Inclusion on this website does not imply or represent a direct relationship with the company, school, or brand. Information, though believed correct at time of publication, may not be correct, and no warranty is provided. Contact the schools to verify any information before relying on it. Financial aid may be available for those who qualify. TradeCollege.org is a for-profit site, and the displayed options may include sponsored or recommended results, not necessarily based on your preferences.
© TradeCollege.org – All Rights Reserved.