Find Trade Colleges
San Juan College Trade Programs
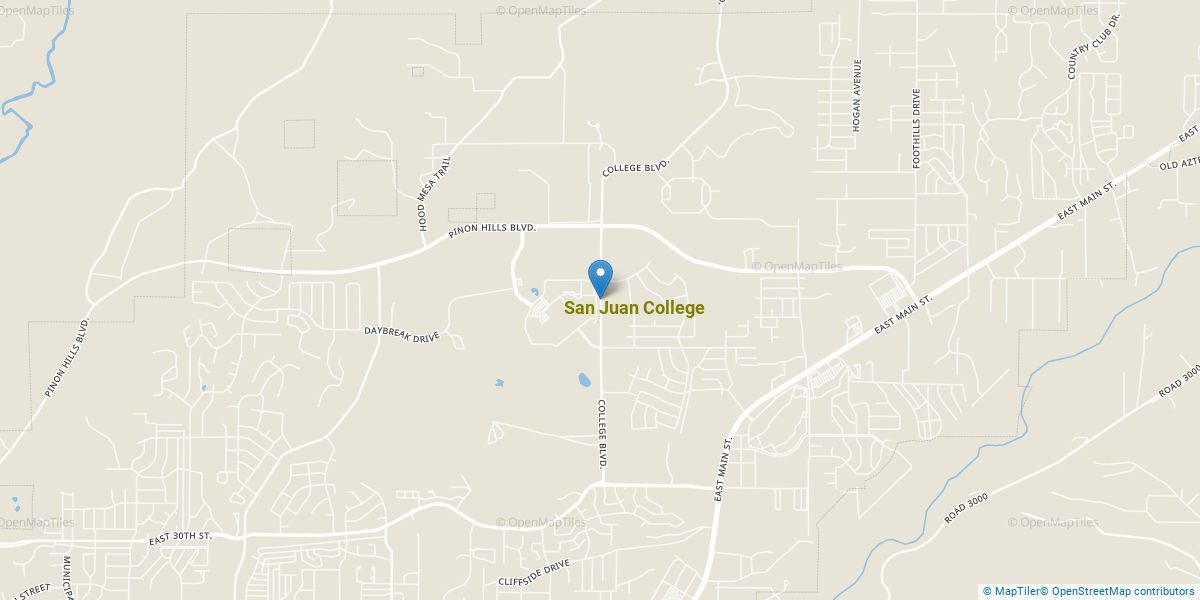
San Juan College is a public institution located in Farmington, New Mexico. The surrounding area of the school is a good match for students who enjoy city life.
Where Is San Juan College?
Contact details for SJC are given below.
| Contact Details | |
|---|---|
| Address: | 4601 College Blvd, Farmington, NM 87402-4699 |
| Phone: | 505-326-3311 |
| Website: | www.sanjuancollege.edu |
Can I Afford SJC?
| In State | Out of State | |
|---|---|---|
| Tuition | $1,344 | $4,272 |
| Fees | $370 | $610 |
| Books and Supplies | $1,420 | $1,420 |
| On Campus Room and Board | $10,480 | $10,480 |
| On Campus Other Expenses | $4,160 | $4,160 |
Student Loan Debt
While almost two-thirds of students nationwide take out loans to pay for college, the percentage may be quite different for the school you plan on attending. At SJC, approximately 5% of students took out student loans averaging $4,626 a year. That adds up to $18,504 over four years for those students.
The student loan default rate at SJC is 3.3%. This is significantly lower than the national default rate of 10.1%, which is a good sign that you'll be able to pay back your student loans.
Explore Best Ranked Schools for You
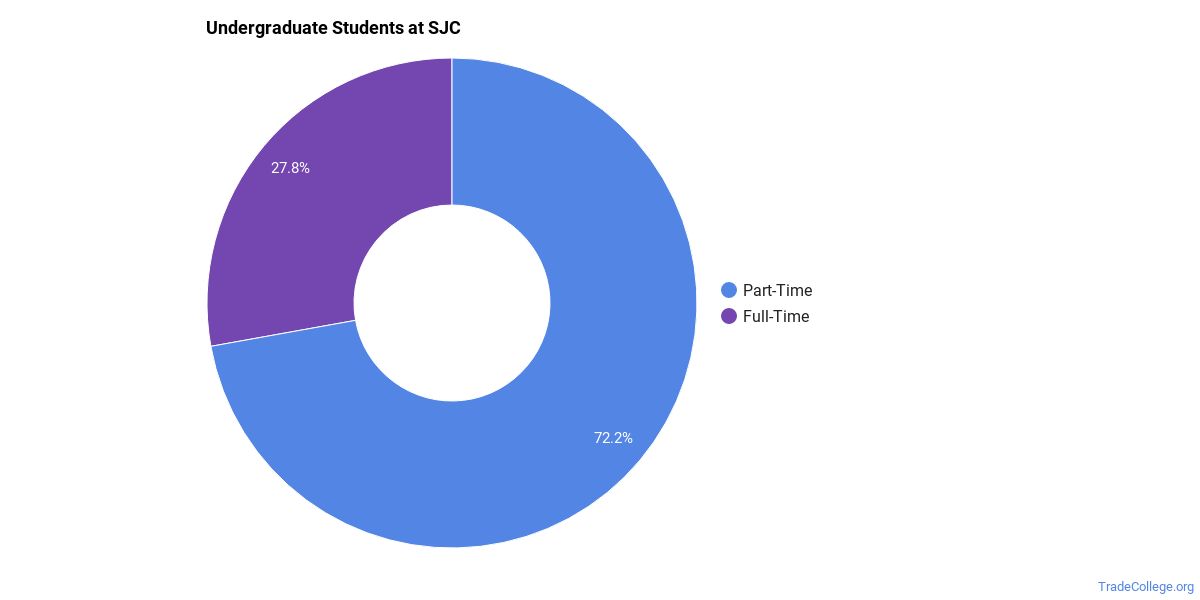
San Juan College Undergraduate Student Diversity
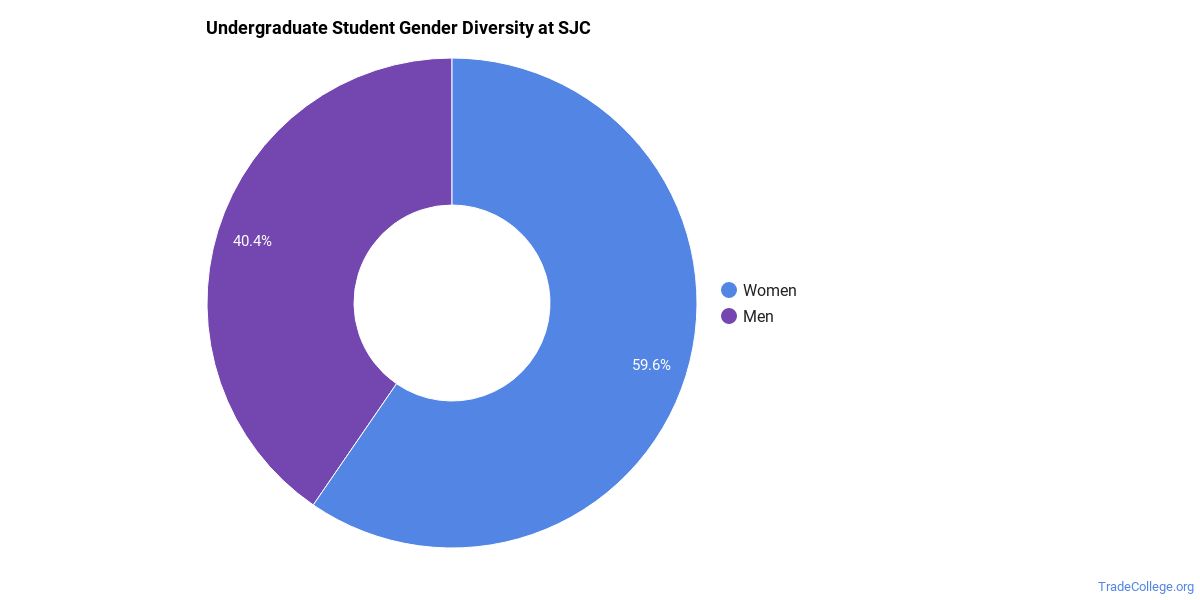
Gender Diversity
Of the 1,477 full-time undergraduates at SJC, 40% are male and 60% are female.
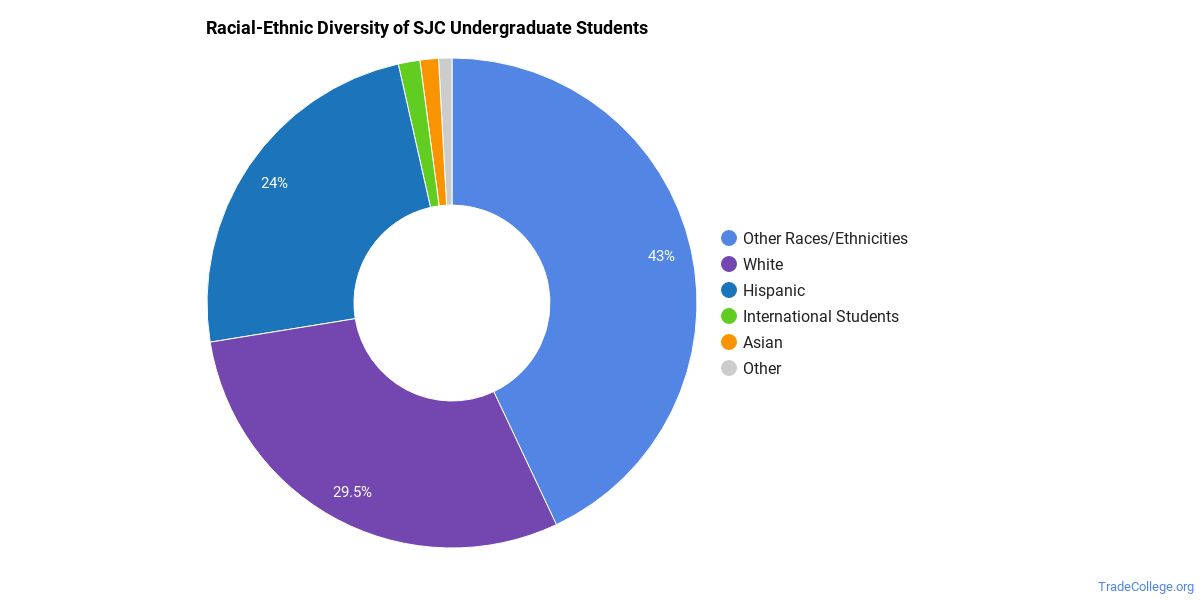
Racial-Ethnic Diversity
The racial-ethnic breakdown of San Juan College students is as follows.
| Race/Ethnicity | Number of Grads |
|---|---|
| Asian | 18 |
| Black or African American | 13 |
| Hispanic or Latino | 355 |
| White | 435 |
| International Students | 21 |
| Other Races/Ethnicities | 635 |
Online Learning at San Juan College
The following chart shows how the online learning population at SJC has changed over the last few years.
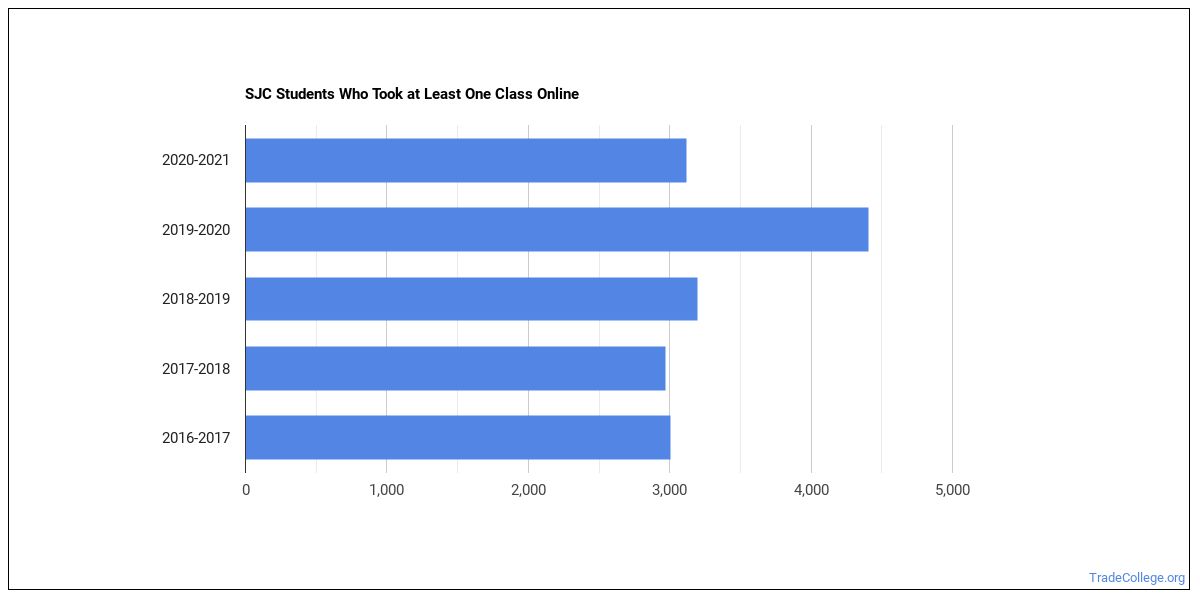
This school is the 2nd most popular in New Mexico for online learning according to the online graduations recorded by the Department of Education for the academic year 2020-2021.
Online Growth Rankings of SJC
The average growth rate over the last four years of online students at San Juan College was 15.4%. This is the #591 largest growth rate of all schools that are mostly online. This refers to all students at SJC regardless of major.
The table below shows how the average growth rate over 4 years at SJC ranks compared to all other mostly online schools that offer a specific major. Note that the majors may or may not be offered online at SJC.
When we speak of partially online, we are referring to schools whose online population is less than 50% of its total student body. Mostly online refers to those with online populations greater than or equal to 50%.
San Juan College Trade School Concentrations
The table below shows the number of awards for each concentration.
San Juan College Trades
In 2021-2022, San Juan College awarded 1,194 undergraduate degrees. The table below shows the number of awards by award type for each trade program. Basic certificates are awards that are completed in less than a year, and undergraduate certificates are those awards that take between one and four years.
| Major | Basic Certificates | Undergrad Certificates | Associate’s | Bachelor’s |
|---|---|---|---|---|
| Allied Health & Medical Assisting Services | 9 | 0 | 39 | 0 |
| Allied Health Professions | 26 | 15 | 19 | 0 |
| Carpentry | 0 | 0 | 3 | 0 |
| Clinical/Medical Laboratory Science | 17 | 0 | 0 | 0 |
| Cosmetology | 7 | 5 | 10 | 0 |
| Dental Support Services | 0 | 0 | 11 | 0 |
| Drafting & Design Engineering Technology | 0 | 1 | 3 | 0 |
| Electromechanical Engineering Technology | 0 | 25 | 27 | 0 |
| Ground Transportation | 97 | 0 | 0 | 0 |
| Health & Medical Administrative Services | 6 | 0 | 8 | 0 |
| Heavy/Industrial Equipment Maintenance | 3 | 4 | 2 | 0 |
| Industrial Production Technology | 0 | 9 | 4 | 0 |
| Practical Nursing & Nursing Assistants | 18 | 0 | 0 | 0 |
| Precision Metal Working | 0 | 17 | 9 | 0 |
| Quality Control Technology | 0 | 3 | 13 | 0 |
| Vehicle Maintenance & Repair | 3 | 10 | 31 | 0 |
| Total | 482 | 252 | 460 | 0 |
References
*The racial-ethnic minorities count is calculated by taking the total number of students and subtracting white students, international students, and students whose race/ethnicity was unknown. This number is then divided by the total number of students at the school to obtain the racial-ethnic minorities percentage.
More about our data sources and methodologies.
TradeCollege.org provides higher-education, college and university, degree, program, career, salary, and other helpful information to students, faculty, institutions, and other internet audiences. Presented information and data are subject to change. Inclusion on this website does not imply or represent a direct relationship with the company, school, or brand. Information, though believed correct at time of publication, may not be correct, and no warranty is provided. Contact the schools to verify any information before relying on it. Financial aid may be available for those who qualify. TradeCollege.org is a for-profit site, and the displayed options may include sponsored or recommended results, not necessarily based on your preferences.
© TradeCollege.org – All Rights Reserved.