Find Trade Colleges
Nashville State Community College Trade Programs
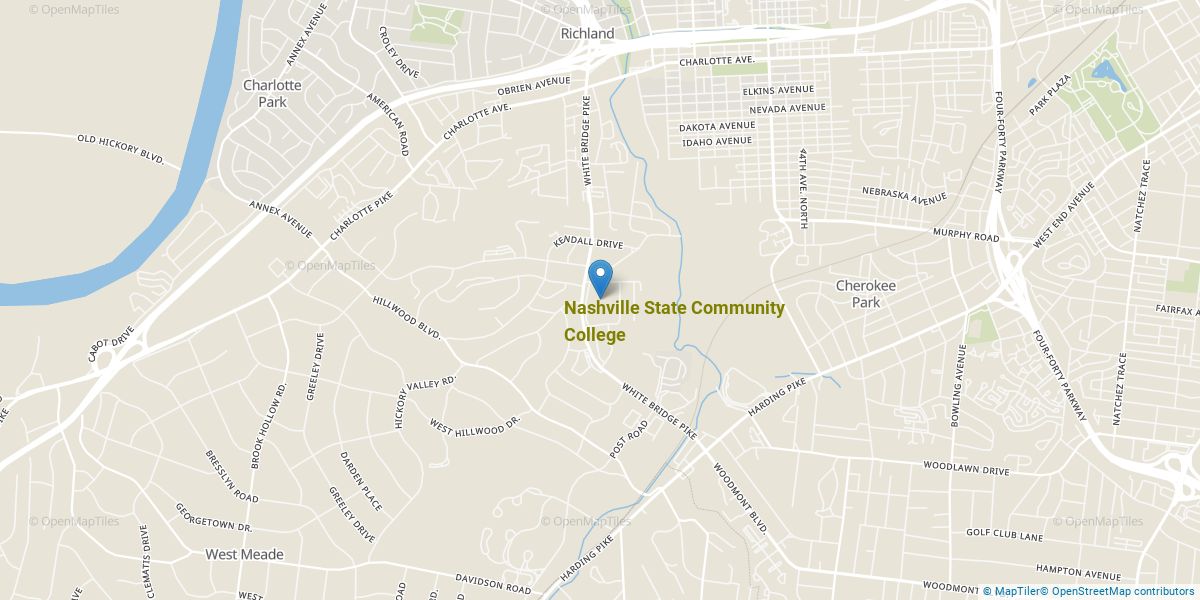
Nashville State Community College is a public institution located in Nashville, Tennessee. The location of the school is great for students who enjoy the amenities of city life.
Where Is Nashville State Community College?
Contact details for Nashville State Community College are given below.
| Contact Details | |
|---|---|
| Address: | 120 White Bridge Rd, Nashville, TN 37209-4515 |
| Phone: | 615-353-3333 |
| Website: | www.nscc.edu |
Can I Afford Nashville State Community College?
| In State | Out of State | |
|---|---|---|
| Tuition | $4,104 | $16,920 |
| Fees | $268 | $268 |
| Books and Supplies | $1,300 | $1,300 |
Student Loan Debt
It's not uncommon for college students to take out loans to pay for school. In fact, almost 66% of students nationwide depend at least partially on loans. At Nashville State Community College, approximately 11% of students took out student loans averaging $4,795 a year. That adds up to $19,180 over four years for those students.
The student loan default rate at Nashville State Community College is 3.6%. This is significantly lower than the national default rate of 10.1%, which is a good sign that you'll be able to pay back your student loans.
Explore Best Ranked Schools for You
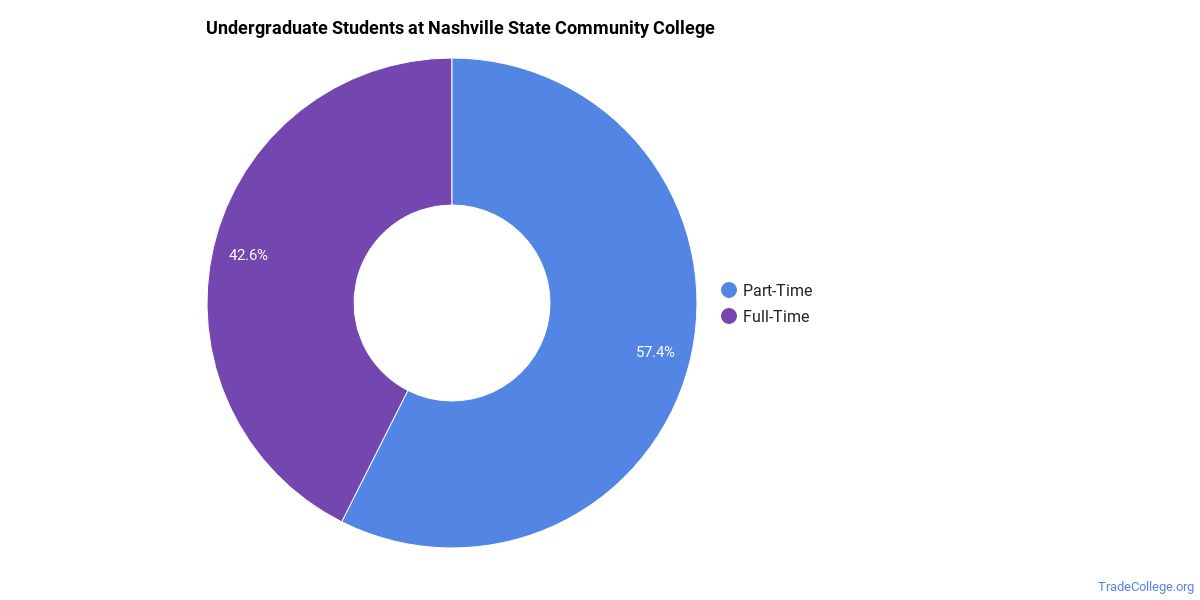
Nashville State Community College Undergraduate Student Diversity
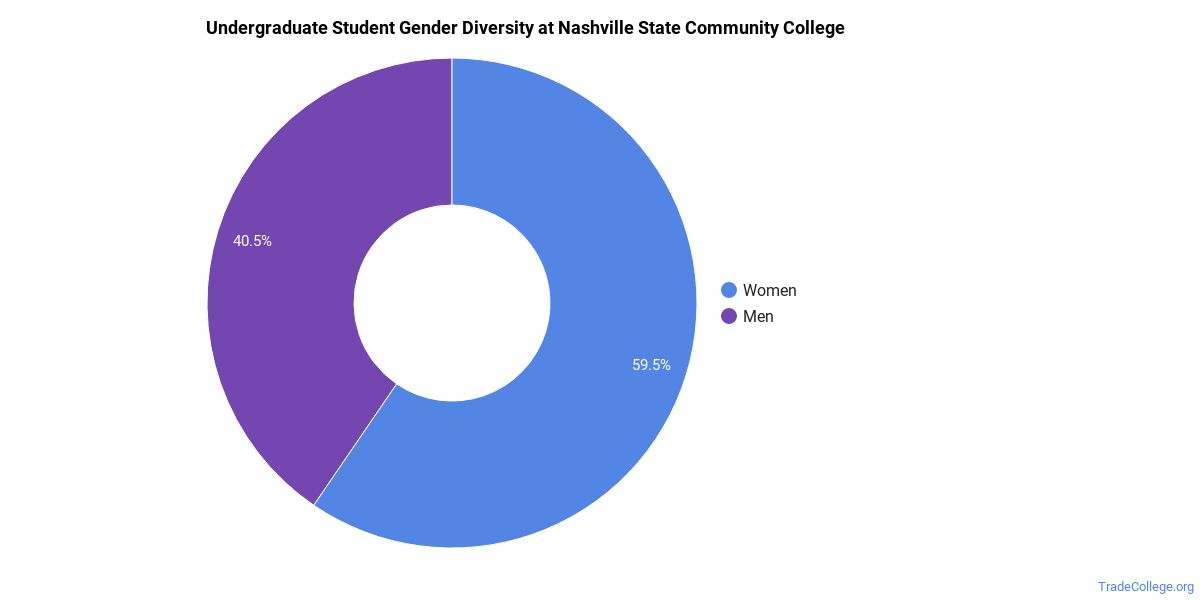
Gender Diversity
Of the 2,830 full-time undergraduates at Nashville State Community College, 40% are male and 60% are female.
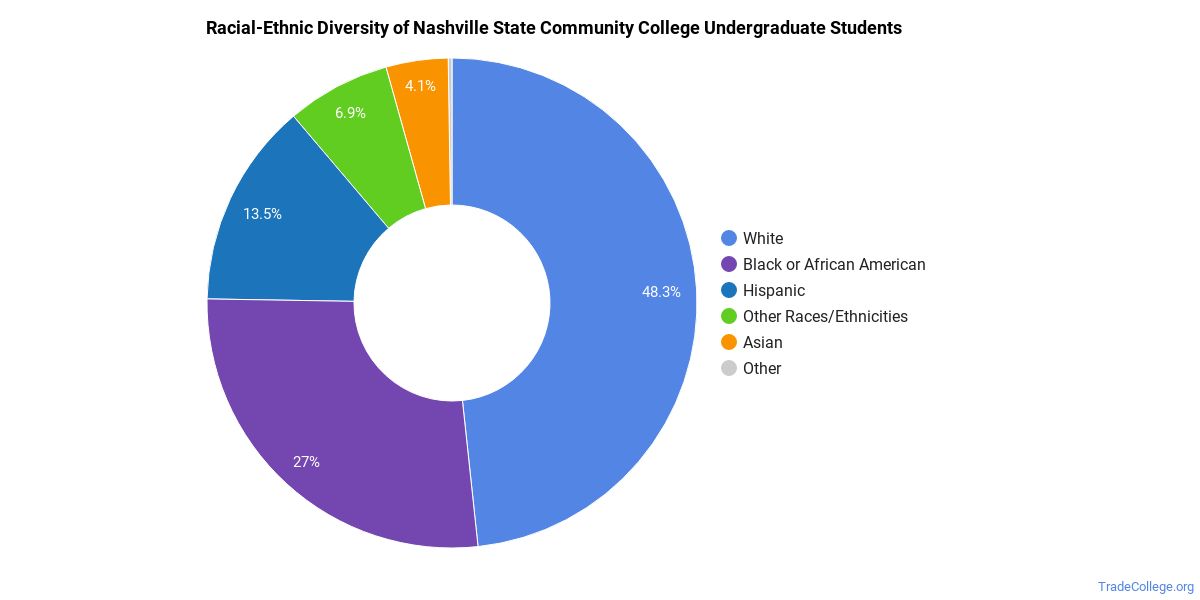
Racial-Ethnic Diversity
The racial-ethnic breakdown of Nashville State Community College students is as follows.
| Race/Ethnicity | Number of Grads |
|---|---|
| Asian | 116 |
| Black or African American | 763 |
| Hispanic or Latino | 383 |
| White | 1,367 |
| International Students | 7 |
| Other Races/Ethnicities | 194 |
Over 14 countries are represented at Nashville State Community College. The most popular countries sending students to the school are Vietnam, South Korea, and Angola.
Online Learning at Nashville State Community College
The following chart shows how the online learning population at Nashville State Community College has changed over the last few years.
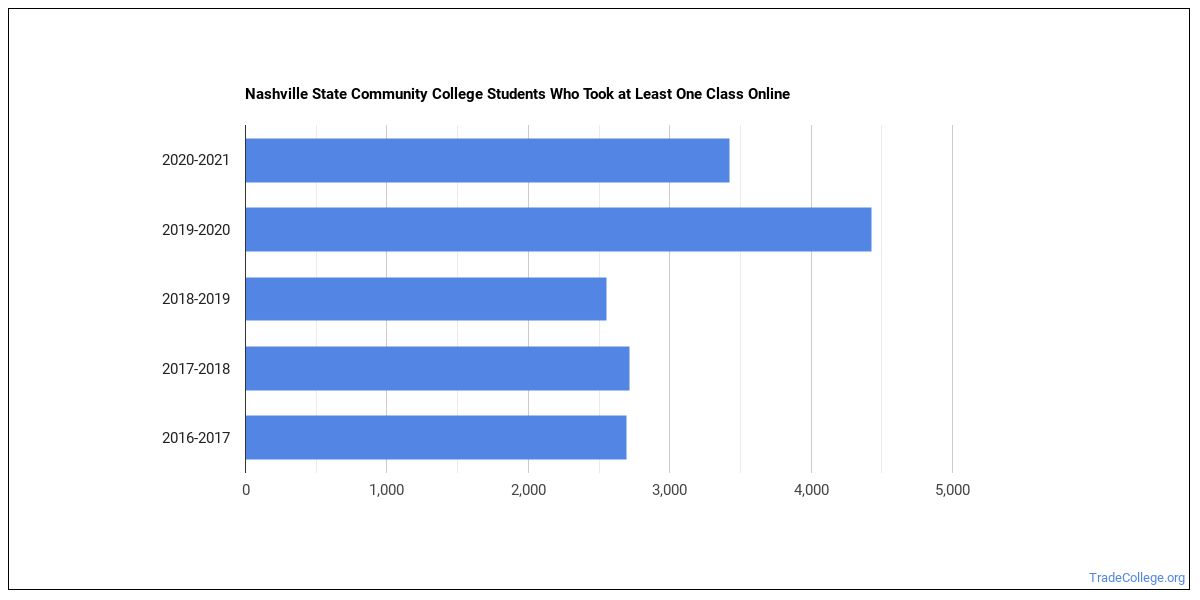
Online Growth Rankings of Nashville State Community College
The average growth rate over the last four years of online students at Nashville State Community College was 7.0%. This is the #1,313 largest growth rate of all schools that are only partially online. This refers to all students at Nashville State Community College regardless of major.
When we speak of partially online, we are referring to schools whose online population is less than 50% of its total student body. Mostly online refers to those with online populations greater than or equal to 50%.
Nashville State Community College Trade School Concentrations
The table below shows the number of awards for each concentration.
| Major | Basic Certificate | Associate’s | Undergraduate Certificate | TOTAL |
|---|---|---|---|---|
| Electromechanical Technology/Electromechanical Engineering Technology | 32 | 0 | 0 | 32 |
| Surgical Technology | 0 | 10 | 22 | 32 |
| Culinary Arts/Chef Training | 0 | 14 | 14 | 28 |
| Occupational Therapist Assistant | 0 | 26 | 0 | 26 |
| Architectural Engineering Technology | 10 | 12 | 0 | 22 |
| Construction Engineering Technology | 0 | 7 | 8 | 15 |
| Electrician | 0 | 0 | 13 | 13 |
| Electrical, Electronic & Communications Engineering Technology | 0 | 13 | 0 | 13 |
| Health Care Management | 0 | 12 | 0 | 12 |
| Manufacturing Engineering Technology | 3 | 5 | 3 | 11 |
| Health Information/Medical Records Technology/Technician | 0 | 0 | 7 | 7 |
| General Drafting & Design Technology | 0 | 0 | 5 | 5 |
| Sterile Processing Technology/Technician | 0 | 0 | 5 | 5 |
| TOTAL | 45 | 99 | 77 | 221 |
Nashville State Community College Trades
In 2021-2022, Nashville State Community College awarded 581 undergraduate degrees. The table below shows the number of awards by award type for each trade program. Basic certificates are awards that are completed in less than a year, and undergraduate certificates are those awards that take between one and four years.
| Major | Basic Certificates | Undergrad Certificates | Associate’s | Bachelor’s |
|---|---|---|---|---|
| Allied Health & Medical Assisting Services | 0 | 0 | 26 | 0 |
| Allied Health Professions | 0 | 22 | 10 | 0 |
| Architectural Engineering Technology | 10 | 0 | 12 | 0 |
| Clinical/Medical Laboratory Science | 0 | 5 | 0 | 0 |
| Construction Engineering Technology | 0 | 8 | 7 | 0 |
| Culinary Arts | 0 | 14 | 14 | 0 |
| Drafting & Design Engineering Technology | 0 | 5 | 0 | 0 |
| Electrical & Power Transmission Installers | 0 | 13 | 0 | 0 |
| Electromechanical Engineering Technology | 32 | 0 | 0 | 0 |
| Electronics Engineering Technology | 0 | 0 | 13 | 0 |
| Health & Medical Administrative Services | 0 | 7 | 12 | 0 |
| Industrial Production Technology | 3 | 3 | 5 | 0 |
| Total | 135 | 197 | 249 | 0 |
References
*The racial-ethnic minorities count is calculated by taking the total number of students and subtracting white students, international students, and students whose race/ethnicity was unknown. This number is then divided by the total number of students at the school to obtain the racial-ethnic minorities percentage.
More about our data sources and methodologies.
TradeCollege.org provides higher-education, college and university, degree, program, career, salary, and other helpful information to students, faculty, institutions, and other internet audiences. Presented information and data are subject to change. Inclusion on this website does not imply or represent a direct relationship with the company, school, or brand. Information, though believed correct at time of publication, may not be correct, and no warranty is provided. Contact the schools to verify any information before relying on it. Financial aid may be available for those who qualify. TradeCollege.org is a for-profit site, and the displayed options may include sponsored or recommended results, not necessarily based on your preferences.
© TradeCollege.org – All Rights Reserved.