Find Trade Colleges
Criminal Justice & Corrections Schools in District of Columbia
294 students earned Criminal Justice degrees in District of Columbia in the 2021-2022 year.
Featured schools near , edit
Education Levels of Criminal Justice & Corrections Majors in District of Columbia
Criminal Justice majors in the state tend to have the following degree levels:
| Education Level | Number of Grads |
|---|---|
| Bachelor’s Degree | 269 |
| Associate Degree | 3 |
Gender Distribution
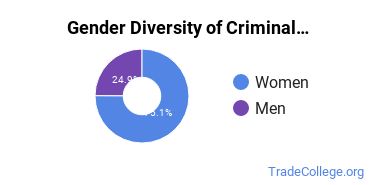
In District of Columbia, a criminal justice major is more popular with women than with men.

Racial Distribution
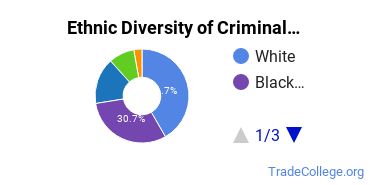
The racial distribution of criminal justice majors in District of Columbia is as follows:
- Asian: 3.4%
- Black or African American: 31.6%
- Hispanic or Latino: 8.8%
- White: 44.6%
- Non-Resident Alien: 2.7%
- Other Races: 8.8%

Jobs for Criminal Justice & Corrections Grads in District of Columbia
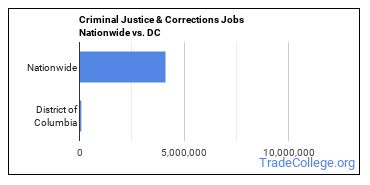
There are 64,230 people in the state and 4,117,080 people in the nation working in criminal justice jobs.

Wages for Criminal Justice & Corrections Jobs in District of Columbia
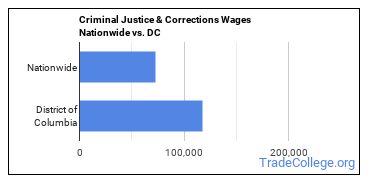
Criminal Justice grads earn an average of $117,540 in the state and $72,390 nationwide.

Criminal Justice & Corrections Careers in DC
Some of the careers criminal justice majors go into include:
| Job Title | DC Job Growth | DC Median Salary |
|---|---|---|
| Protective Service Worker Supervisors | 10% | $58,850 |
| Private Detectives and Investigators | 9% | $68,940 |
| Police and Sheriff’s Patrol Officers | 2% | $71,570 |
| Detectives and Criminal Investigators | 2% | $133,330 |
Explore Major by State
Alabama
Arkansas
Connecticut
Florida
Idaho
Iowa
Louisiana
Massachusetts
Mississippi
Nebraska
New Jersey
North Carolina
Oklahoma
Rhode Island
Tennessee
Vermont
West Virginia
View Nationwide Criminal Justice & Corrections Report
References
More about our data sources and methodologies.
