Find Trade Colleges
Nanotech
Types of Degrees Nanotech Majors Are Getting
The following table lists how many nanotechnology graduations there were in 2021-2022 for each degree level.
| Education Level | Number of Grads |
|---|---|
| Bachelor’s Degree | 7 |
| Associate Degree | 6 |
| Basic Certificate | 2 |
What Nanotech Majors Need to Know
O*NET surveyed people in occupations related to nanotech and asked them what knowledge areas, skills, and abilities were important for their jobs. The responses were rated on a scale of 1 to 5 with 5 being most important.
Knowledge Areas for Nanotech Majors
According to O*NET survey takers, a major in nanotech should prepare you for careers in which you will need to be knowledgeable in the following areas:
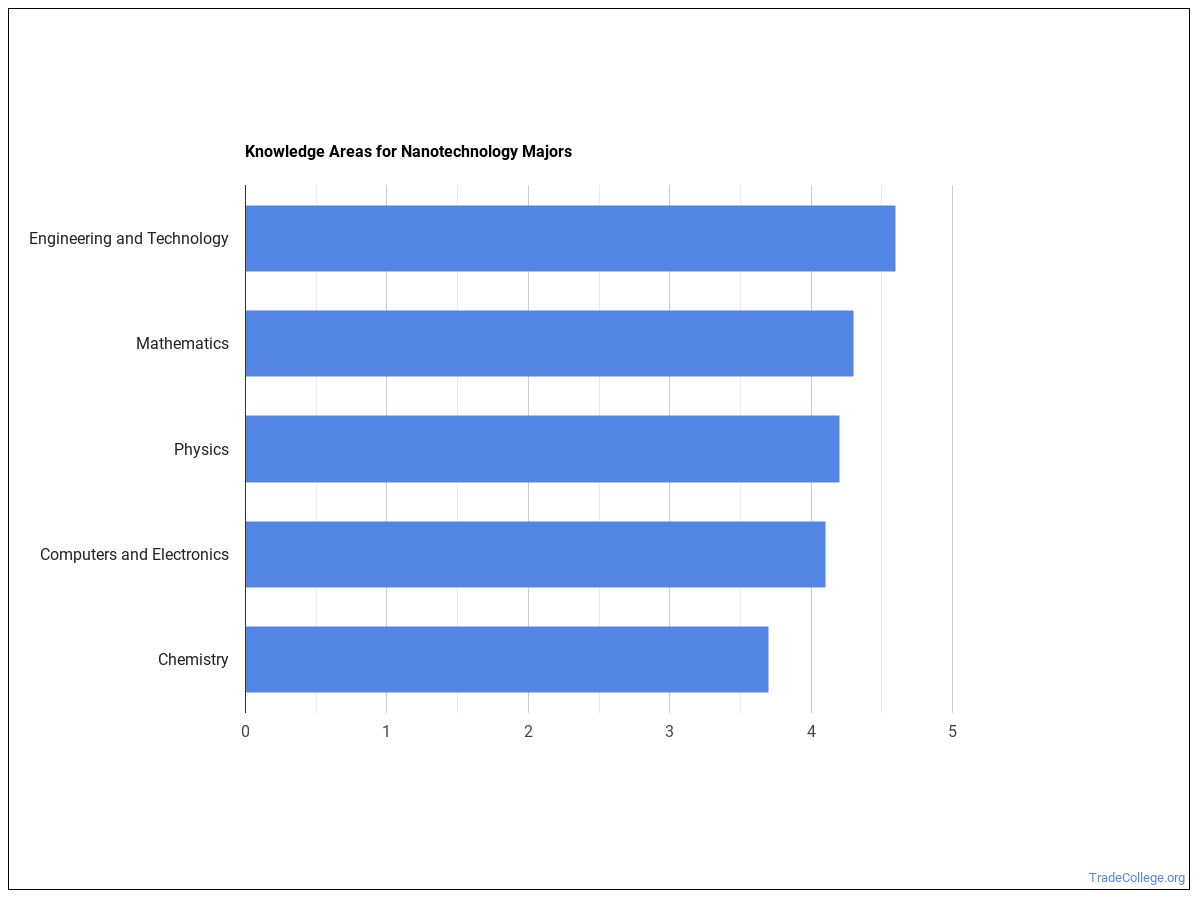
- Engineering and Technology - Knowledge of the practical application of engineering science and technology. This includes applying principles, techniques, procedures, and equipment to the design and production of various goods and services.
- Mathematics - Knowledge of arithmetic, algebra, geometry, calculus, statistics, and their applications.
- Physics - Knowledge and prediction of physical principles, laws, their interrelationships, and applications to understanding fluid, material, and atmospheric dynamics, and mechanical, electrical, atomic and sub- atomic structures and processes.
- Computers and Electronics - Knowledge of circuit boards, processors, chips, electronic equipment, and computer hardware and software, including applications and programming.
- Chemistry - Knowledge of the chemical composition, structure, and properties of substances and of the chemical processes and transformations that they undergo. This includes uses of chemicals and their interactions, danger signs, production techniques, and disposal methods.
Skills for Nanotech Majors
The following list of skills has been highlighted as some of the most essential for careers related to nanotech:
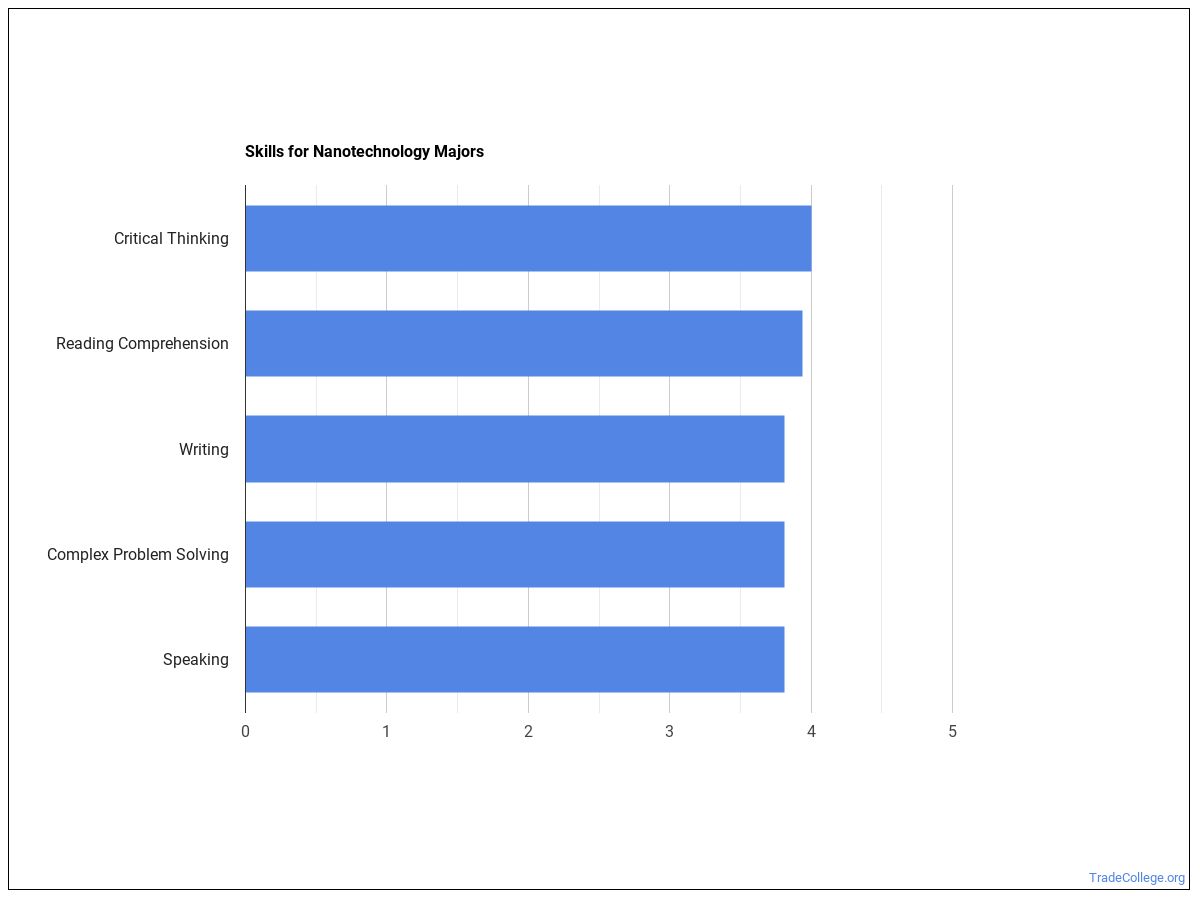
- Critical Thinking - Using logic and reasoning to identify the strengths and weaknesses of alternative solutions, conclusions or approaches to problems.
- Reading Comprehension - Understanding written sentences and paragraphs in work related documents.
- Writing - Communicating effectively in writing as appropriate for the needs of the audience.
- Complex Problem Solving - Identifying complex problems and reviewing related information to develop and evaluate options and implement solutions.
- Active Listening - Giving full attention to what other people are saying, taking time to understand the points being made, asking questions as appropriate, and not interrupting at inappropriate times.
Abilities for Nanotech Majors
Nanotech majors often go into careers where the following abilities are vital:
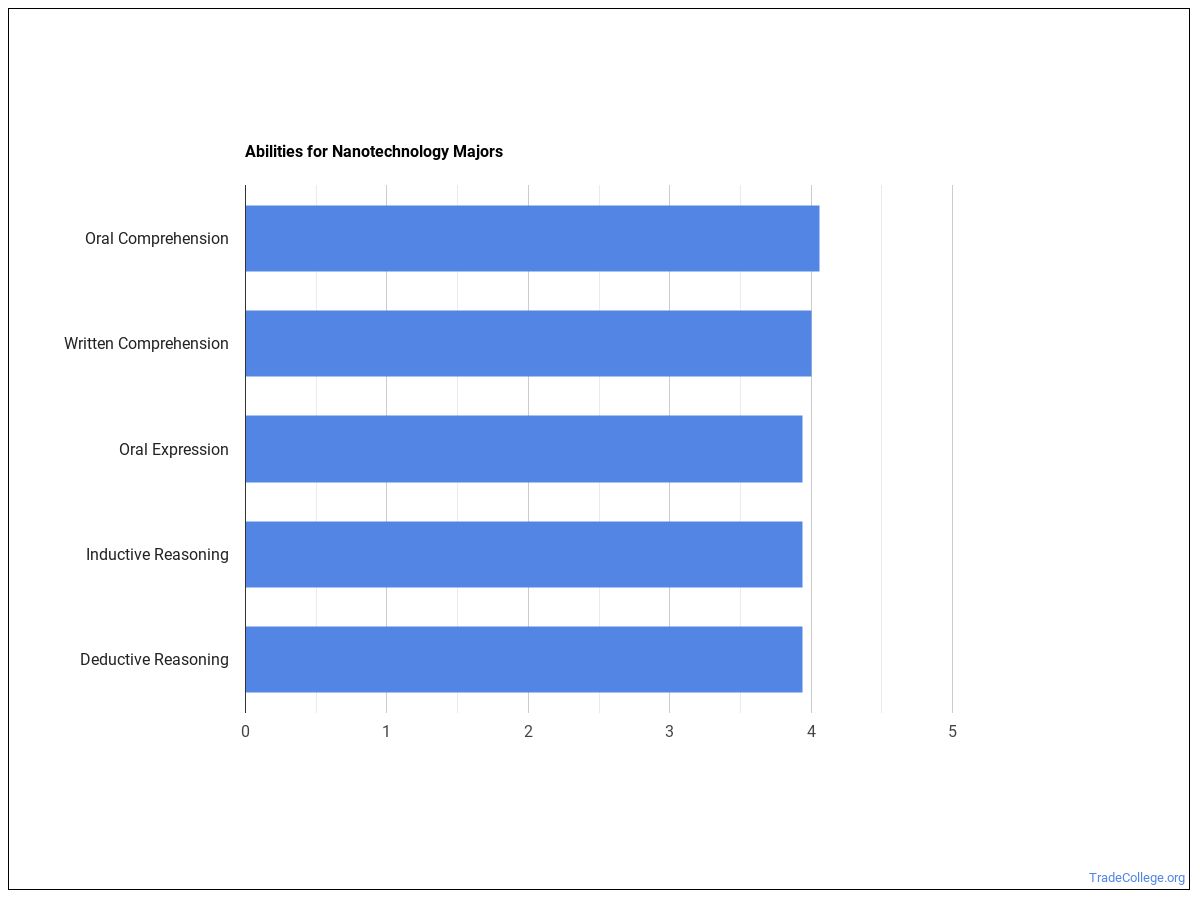
- Oral Comprehension - The ability to listen to and understand information and ideas presented through spoken words and sentences.
- Written Comprehension - The ability to read and understand information and ideas presented in writing.
- Oral Expression - The ability to communicate information and ideas in speaking so others will understand.
- Deductive Reasoning - The ability to apply general rules to specific problems to produce answers that make sense.
- Inductive Reasoning - The ability to combine pieces of information to form general rules or conclusions (includes finding a relationship among seemingly unrelated events).
Who Is Getting an Associate’s Degree in Nanotech?
Racial-Ethnic Diversity
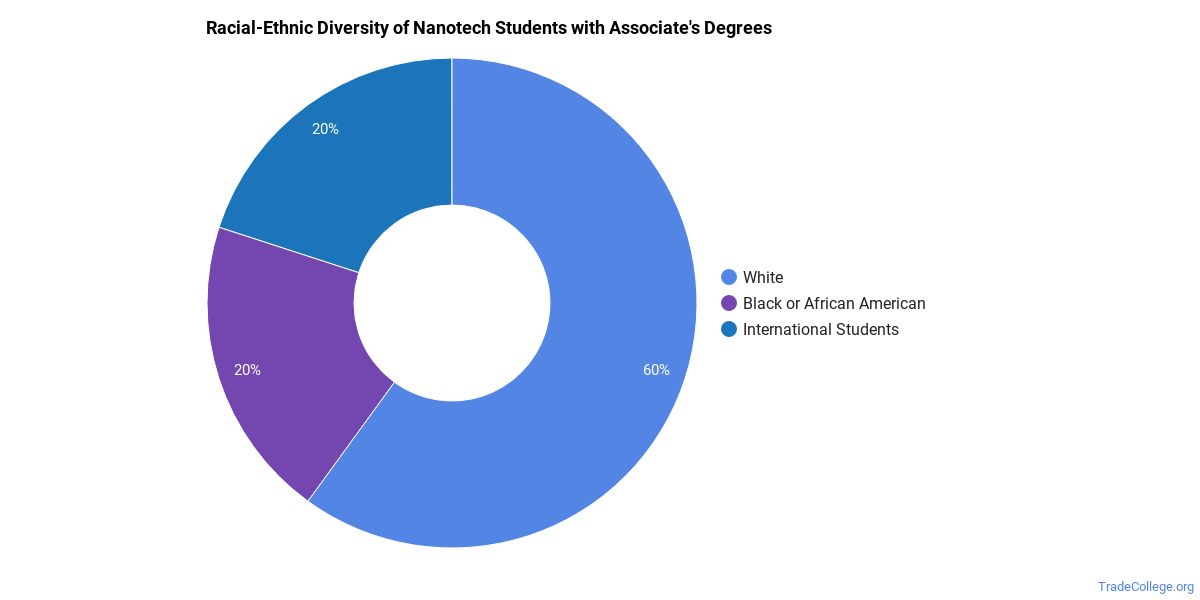
At the countrywide level, the racial-ethnic distribution of nanotech majors is as follows:
| Race/Ethnicity | Number of Grads |
|---|---|
| Asian | 1 |
| Black or African American | 0 |
| Hispanic or Latino | 1 |
| White | 4 |
| International Students | 0 |
| Other Races/Ethnicities | 0 |
How Much Do Nanotech Majors Make?
Salaries According to BLS
The median salary for someone in a career related to nanotech is $99,410. This median refers to all degree levels, so you may expect those with a more advanced degree to make more while those with less advanced degrees will typically make less.
To put that into context, according to BLS data from the first quarter of 2020, the typical high school graduate makes between $30,000 and $57,900 a year (25th through 75th percentile). The average person with a bachelor’s degree (any field) makes between $45,600 and $99,000. Advanced degree holders make the most with salaries between $55,600 and $125,400.
Amount of Education Required for Careers Related to Nanotech
Some degrees associated with nanotech may require an advanced degree, while others may not even require a bachelor’s in the field. Whatever the case may be, pursuing more education usually means that more career options will be available to you.
Find out what the typical degree level is for nanotech careers below.

| Education Level | Percentage of Workers |
|---|---|
| Associate’s Degree (or other 2-year degree) | 0.1% |
| Bachelor’s Degree | 17.3% |
| Post-Baccalaureate Certificate - awarded for completion of an organized program of study; designed for people who have completed a Baccalaureate degree but do not meet the requirements of academic degrees carrying the title of Master. | 7.7% |
| Master’s Degree | 35.5% |
| Post-Master’s Certificate - awarded for completion of an organized program of study; designed for people who have completed a Master’s degree but do not meet the requirements of academic degrees at the doctoral level. | 4.8% |
| First Professional Degree - awarded for completion of a program that: requires at least 2 years of college work before entrance into the program, includes a total of at least 6 academic years of work to complete, and provides all remaining academic requirements to begin practice in a profession. | 2.4% |
| Doctoral Degree | 25.7% |
| Post-Doctoral Training | 4.8% |
Online Nanotech Programs
The following table lists the number of programs by degree level, along with how many schools offered online courses in the field.
| Degree Level | Colleges Offering Programs | Colleges Offering Online Classes |
|---|---|---|
| Certificate (Less Than 1 Year) | 0 | 0 |
| Certificate (1-2 years) | 4 | 0 |
| Certificate (2-4 Years) | 0 | 0 |
| Associate’s Degree | 8 | 1 |
| Bachelor’s Degree | 5 | 1 |
| Post-Baccalaureate | 0 | 0 |
| Master’s Degree | 11 | 0 |
| Post-Master’s | 4 | 0 |
| Doctor’s Degree (Research) | 5 | 0 |
| Doctor’s Degree (Professional Practice) | 0 | 0 |
| Doctor’s Degree (Other) | 0 | 0 |
Is a Degree in Nanotech Worth It?
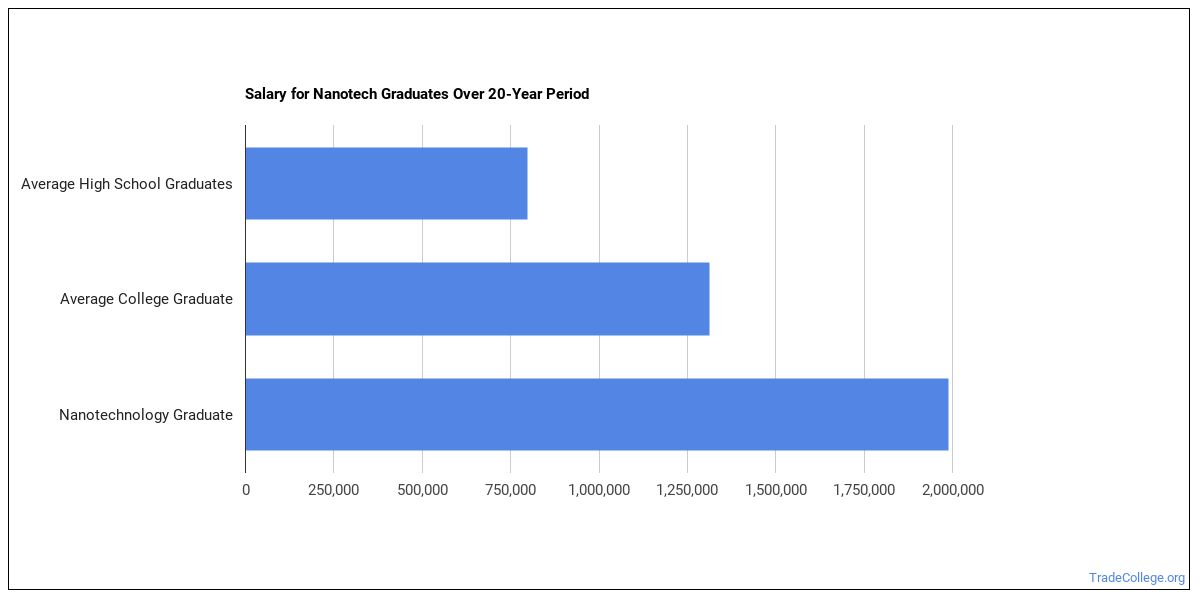
The median salary for a nanotech grad is $99,410 per year. This is based on the weighted average of the most common careers associated with the major.
This is 149% more than the average salary for an individual holding a high school degree. This adds up to a gain of about $1,190,200 after 20 years!
Explore Major by State
Alabama
California
District of Columbia
Idaho
Kansas
Maryland
Mississippi
Nevada
New York
Oklahoma
South Carolina
Utah
West Virginia
Alaska
Colorado
Florida
Illinois
Kentucky
Massachusetts
Missouri
New Hampshire
North Carolina
Oregon
South Dakota
Vermont
Wisconsin
References
*The racial-ethnic minorities count is calculated by taking the total number of students and subtracting white students, international students, and students whose race/ethnicity was unknown. This number is then divided by the total number of students at the school to obtain the racial-ethnic minorities percentage.
- College Factual
- College Scorecard
- National Center for Education Statistics
- O*NET Online
- U.S. Bureau of Labor Statistics
- Usual Weekly Earnings of Wage and Salary Workers First Quarter 2020
- Image Credit: By Health Sciences and Nutrition, CSIRO under License
More about our data sources and methodologies.

TradeCollege.org provides higher-education, college and university, degree, program, career, salary, and other helpful information to students, faculty, institutions, and other internet audiences. Presented information and data are subject to change. Inclusion on this website does not imply or represent a direct relationship with the company, school, or brand. Information, though believed correct at time of publication, may not be correct, and no warranty is provided. Contact the schools to verify any information before relying on it. Financial aid may be available for those who qualify. TradeCollege.org is a for-profit site, and the displayed options may include sponsored or recommended results, not necessarily based on your preferences.
© TradeCollege.org – All Rights Reserved.