Find Trade Colleges
University of Wisconsin - La Crosse Trade Programs
University of Wisconsin - La Crosse is a public institution situated in La Crosse, Wisconsin. The city atmosphere of La Crosse makes it a great place for students who enjoy having lots of educational and entertainment options.
Featured schools near , edit
Where Is University of Wisconsin - La Crosse?
Contact details for UW - La Crosse are given below.
| Contact Details | |
|---|---|
| Address: | 1725 State St, La Crosse, WI 54601-9959 |
| Phone: | 608-785-8000 |
| Website: | www.uwlax.edu |
Can I Afford UW - La Crosse?
| In State | Out of State | |
|---|---|---|
| Tuition | $7,974 | $17,014 |
| Fees | $1,677 | $1,677 |
| Books and Supplies | $120 | $120 |
| On Campus Room and Board | $7,960 | $7,960 |
| On Campus Other Expenses | $2,036 | $2,036 |
Student Loan Debt
Almost 66% of college students who graduated with the class of 2018 took out student loans, but that percentage varies from school to school. At UW - La Crosse, approximately 47% of students took out student loans averaging $6,861 a year. That adds up to $27,444 over four years for those students.
University of Wisconsin - La Crosse Undergraduate Student Diversity
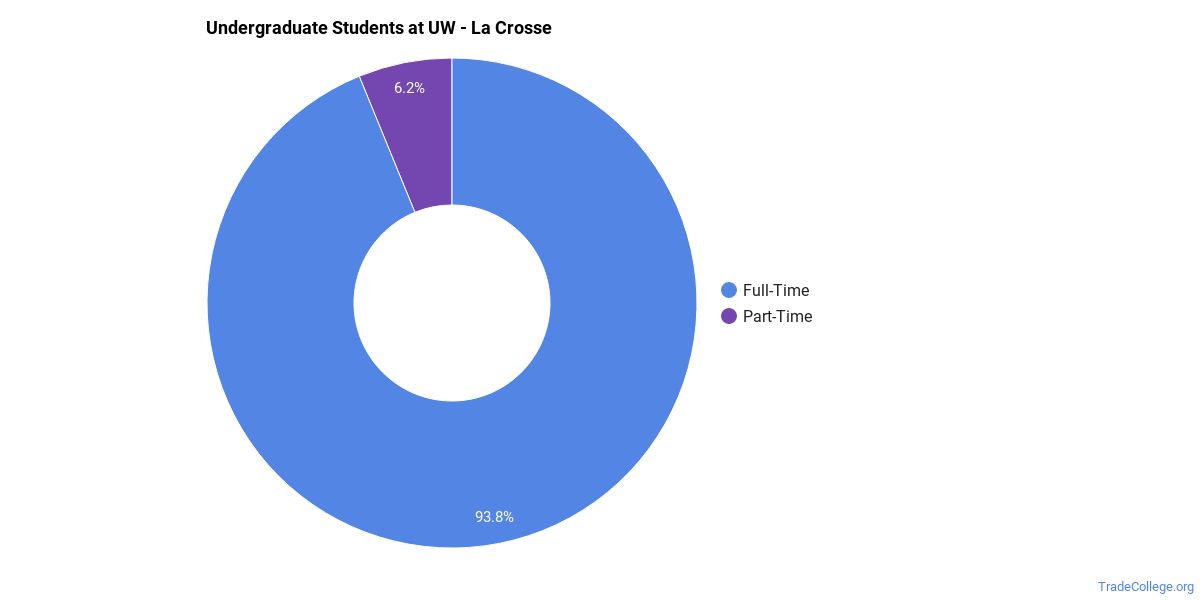
There are also 969 graduate students at the school.
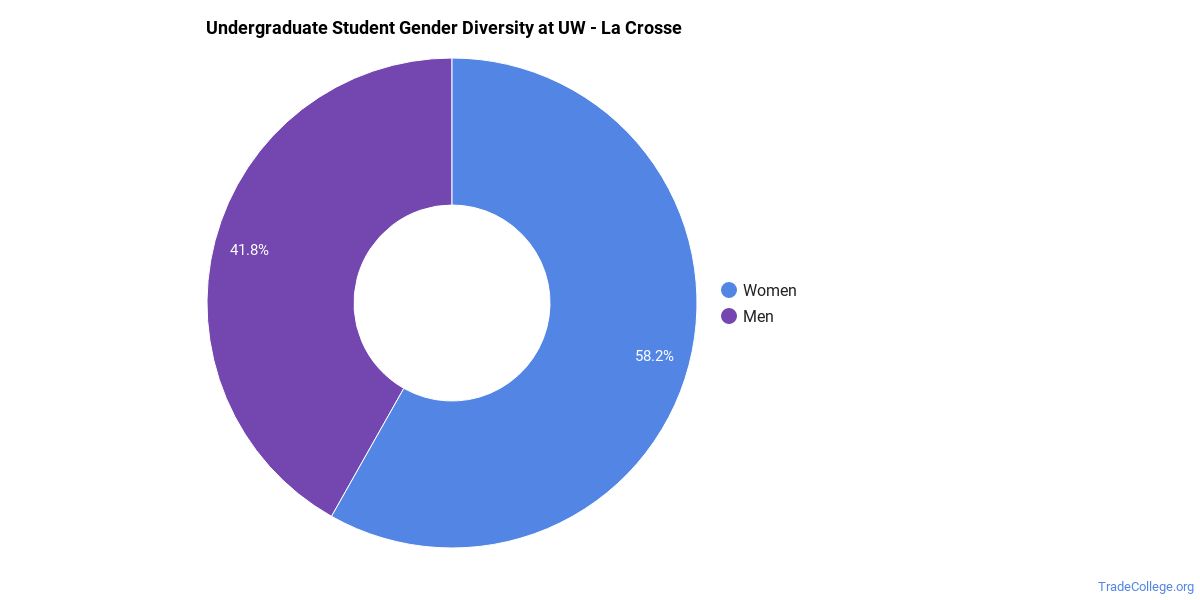
Gender Diversity
Of the 8,863 full-time undergraduates at UW - La Crosse, 42% are male and 58% are female.
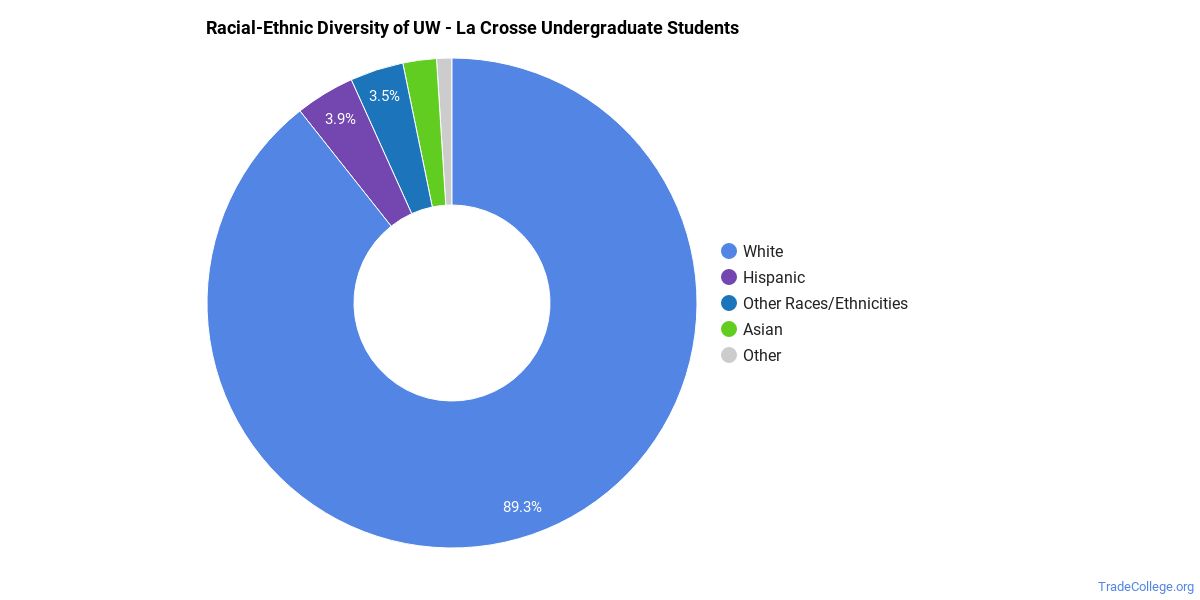
Racial-Ethnic Diversity
The racial-ethnic breakdown of University of Wisconsin - La Crosse students is as follows.
| Race/Ethnicity | Number of Grads |
|---|---|
| Asian | 177 |
| Black or African American | 45 |
| Hispanic or Latino | 360 |
| White | 7,950 |
| International Students | 29 |
| Other Races/Ethnicities | 302 |
Geographic Diversity
Wisconsin students aren't the only ones who study at University of Wisconsin - La Crosse. At this time, 17 states are represented by the student population at the school.
Over 25 countries are represented at UW - La Crosse. The most popular countries sending students to the school are China, Saudi Arabia, and Japan.
University of Wisconsin - La Crosse Trade School Concentrations
The table below shows the number of awards for each concentration.
| Major | Bachelor’s | TOTAL |
|---|---|---|
| Laboratory Sciences & Medical Technology | 23 | 23 |
| Nuclear Medical Technology/Technologist | 20 | 20 |
| Medical Radiologic Technology/Science - Radiation Therapy | 19 | 19 |
| General Health & Wellness | 4 | 4 |
| Health Information Management | 2 | 2 |
| Athletic Training | 0 | 0 |
| TOTAL | 68 | 68 |
References
*The racial-ethnic minorities count is calculated by taking the total number of students and subtracting white students, international students, and students whose race/ethnicity was unknown. This number is then divided by the total number of students at the school to obtain the racial-ethnic minorities percentage.
- College Factual
- National Center for Education Statistics
- Image Credit: By Lacrossewi under License
More about our data sources and methodologies.
TradeCollege.org provides higher-education, college and university, degree, program, career, salary, and other helpful information to students, faculty, institutions, and other internet audiences. Presented information and data are subject to change. Inclusion on this website does not imply or represent a direct relationship with the company, school, or brand. Information, though believed correct at time of publication, may not be correct, and no warranty is provided. Contact the schools to verify any information before relying on it. Financial aid may be available for those who qualify. TradeCollege.org is a for-profit site, and the displayed options may include sponsored or recommended results, not necessarily based on your preferences.
© TradeCollege.org – All Rights Reserved.