Find Trade Colleges
Tarrant County College District Trade Programs
Located in Fort Worth, Texas, Tarrant County College District is a public institution. The city atmosphere of Fort Worth makes it a great place for students who enjoy having lots of educational and entertainment options.
Featured schools near , edit
Where Is Tarrant County College District?
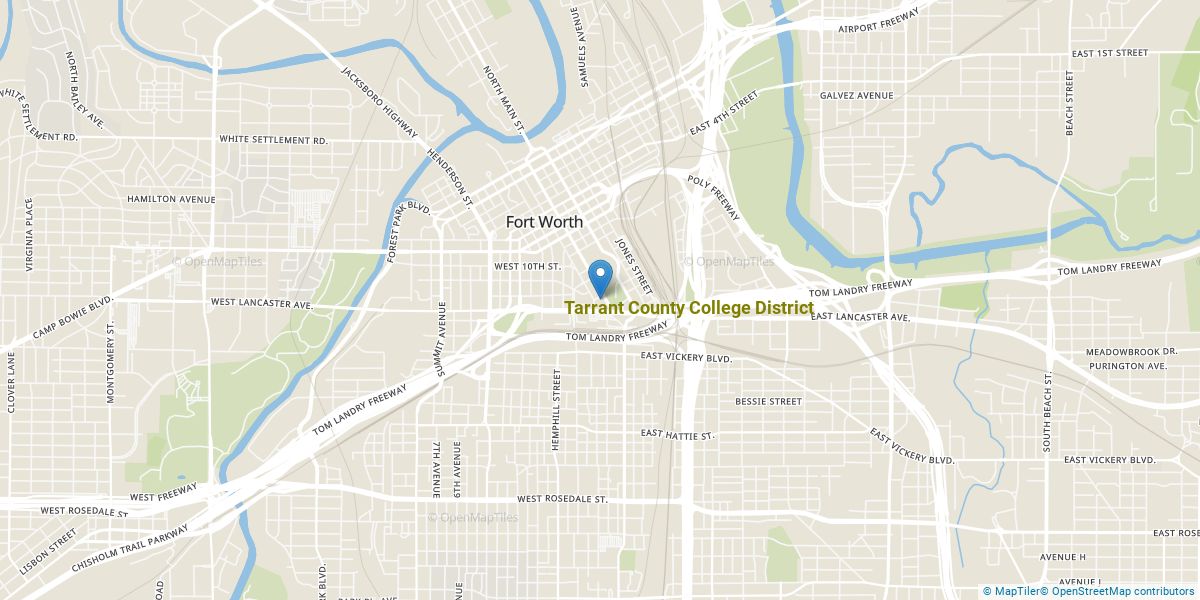
Contact details for Tarrant County College are given below.
| Contact Details | |
|---|---|
| Address: | 300 Trinity Campus Circle, Fort Worth, TX 76102 |
| Phone: | 817-515-8223 |
| Website: | www.tccd.edu |
Can I Afford Tarrant County College?
| In State | Out of State | |
|---|---|---|
| Tuition | $3,402 | $8,235 |
| Books and Supplies | $1,719 | $1,719 |
Student Loan Debt
Almost 66% of college students who graduated with the class of 2018 took out student loans, but that percentage varies from school to school. At Tarrant County College, approximately 8% of students took out student loans averaging $4,916 a year. That adds up to $19,664 over four years for those students.
Tarrant County College District Undergraduate Student Diversity
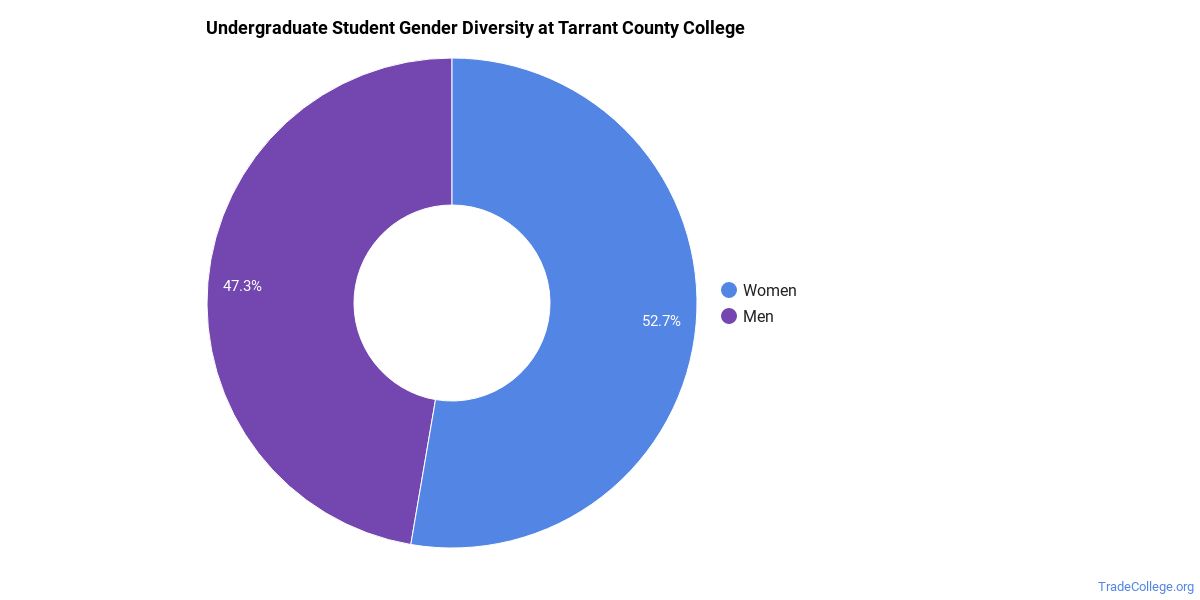
Gender Diversity
Of the 8,643 full-time undergraduates at Tarrant County College, 43% are male and 57% are female.
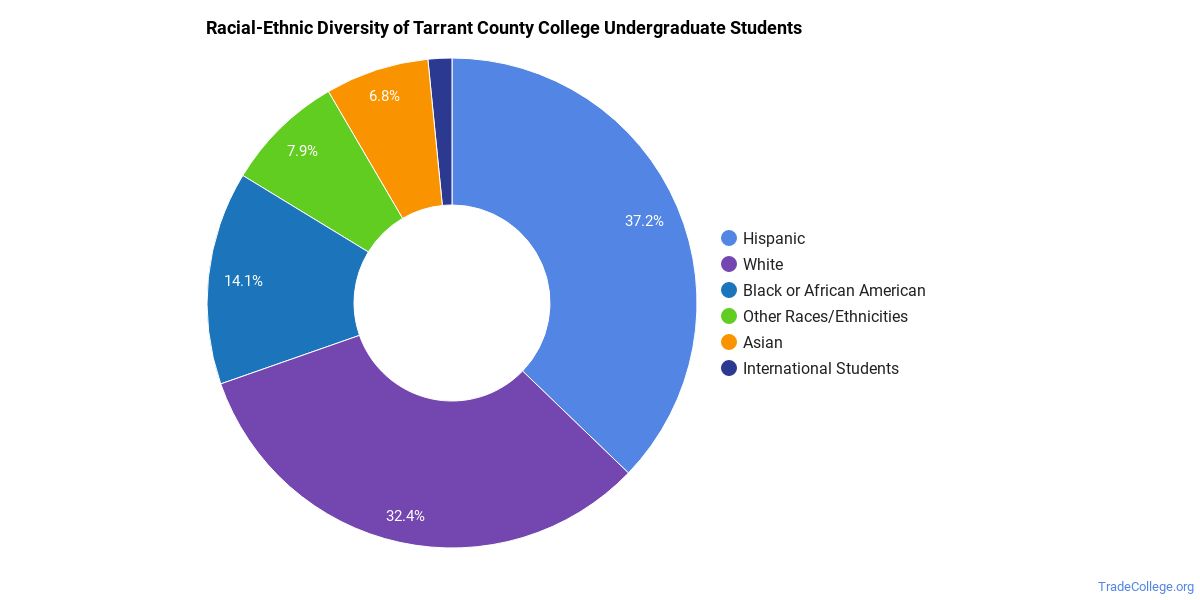
Racial-Ethnic Diversity
The racial-ethnic breakdown of Tarrant County College District students is as follows.
| Race/Ethnicity | Number of Grads |
|---|---|
| Asian | 597 |
| Black or African American | 1,290 |
| Hispanic or Latino | 3,149 |
| White | 2,868 |
| International Students | 144 |
| Other Races/Ethnicities | 595 |
Over 68 countries are represented at Tarrant County College. The most popular countries sending students to the school are Vietnam, Nepal, and India.
Tarrant County College District Trade School Concentrations
The table below shows the number of awards for each concentration.
References
*The racial-ethnic minorities count is calculated by taking the total number of students and subtracting white students, international students, and students whose race/ethnicity was unknown. This number is then divided by the total number of students at the school to obtain the racial-ethnic minorities percentage.
More about our data sources and methodologies.
TradeCollege.org provides higher-education, college and university, degree, program, career, salary, and other helpful information to students, faculty, institutions, and other internet audiences. Presented information and data are subject to change. Inclusion on this website does not imply or represent a direct relationship with the company, school, or brand. Information, though believed correct at time of publication, may not be correct, and no warranty is provided. Contact the schools to verify any information before relying on it. Financial aid may be available for those who qualify. TradeCollege.org is a for-profit site, and the displayed options may include sponsored or recommended results, not necessarily based on your preferences.
© TradeCollege.org – All Rights Reserved.