Find Trade Colleges
Industrial & Management Engineering at Stevens Institute of Technology
What traits are you looking for in a school for Industrial & Management Engineering, consider the program at Stevens Institute of Technology. We’ve gathered the following information to help you decide.
Stevens Institute of Technology is in Hoboken, NJ.
During the most recent reporting year, 175 industrial & management engineering degrees were granted at Stevens Institute of Technology.
Online & Distance Learning at Stevens Institute of Technology
Many students take online classes at Stevens Institute of Technology. Among 8,469 students, 1,159 (14%) studied exclusively online and 2,669 (32%) took at least some classes online.
Industrial & Management Engineering Rankings at Stevens Institute of Technology
These rankings give you a sense of how Stevens Institute of Technology’s Industrial & Management Engineering program to other colleges that offer this major.
Bachelor’s-Level Rankings
| Ranking | Scope | Rank |
|---|---|---|
| Best Schools (Quality) | New Jersey | #3 of 4 |
| Best Value | New Jersey | #4 of 4 |
| Best Schools (Quality) | Middle Atlantic (Region) | #16 of 20 |
| Best Value | Middle Atlantic (Region) | #19 of 20 |
| Best Schools (Quality) | Nationwide | #70 of 118 |
| Best Value | Nationwide | #113 of 118 |
Student Demographics & Diversity
Below you’ll find the composition of Industrial & Management Engineering graduates at Stevens Institute of Technology, broken down by degree level.
Looking at the program as a whole, Industrial & Management Engineering graduates at Stevens Institute of Technology are 31% women (55) and 69% men (120).
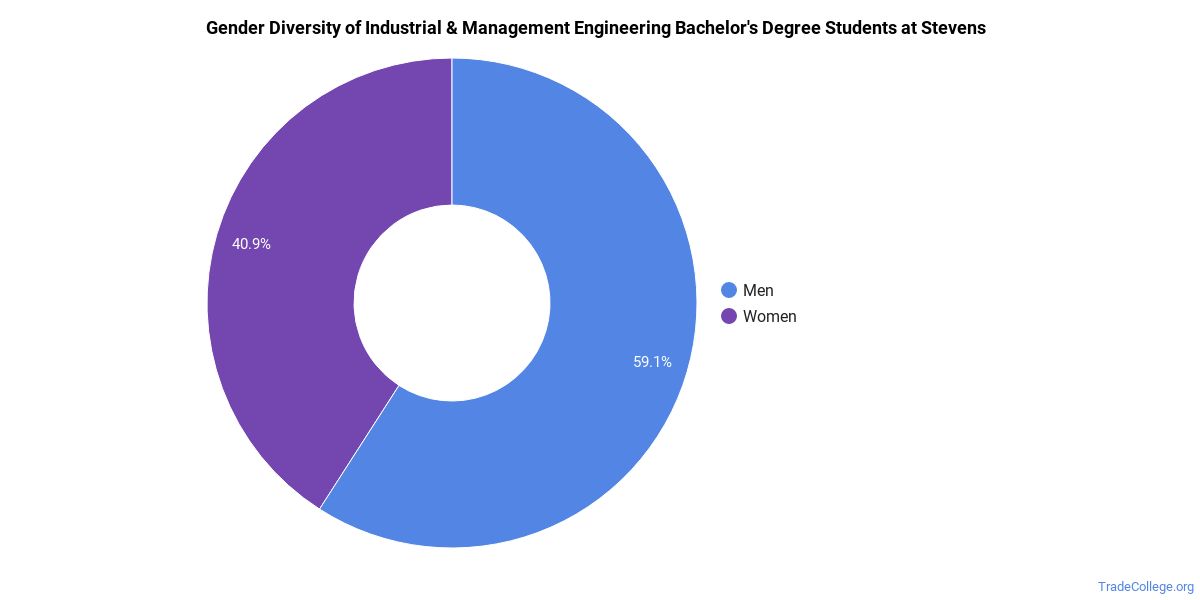
Industrial & Management Engineering Bachelor’s Program at Stevens Institute of Technology
Of the 23 bachelor’s industrial & management engineering graduates at Stevens Institute of Technology, 26% were women (6) and 74% were men (17).
The following table and chart show the race/ethnicity of Industrial & Management Engineering bachelor’s degree recipients at Stevens Institute of Technology.
| Race / Ethnicity | Number of Graduates |
|---|---|
| White | 14 |
| Hispanic / Latino | 3 |
| Asian | 2 |
| Two or More Races | 2 |
| International (Nonresident) | 2 |
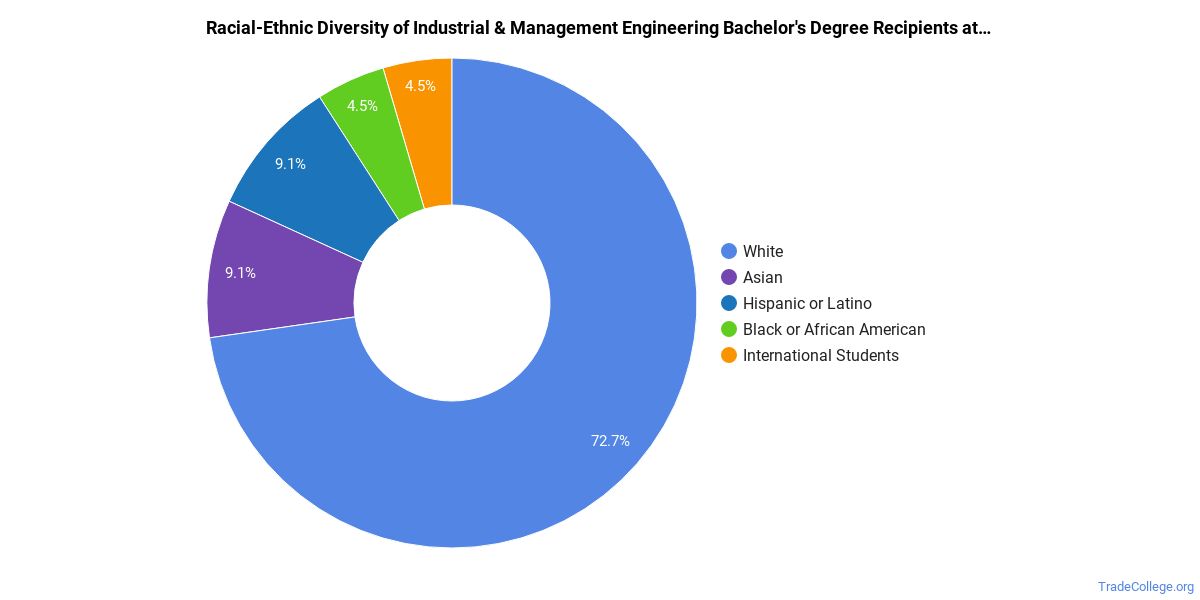
Minority students account for 30% of Industrial & Management Engineering bachelor’s degree recipients at Stevens Institute of Technology, above the national average of 28%.*
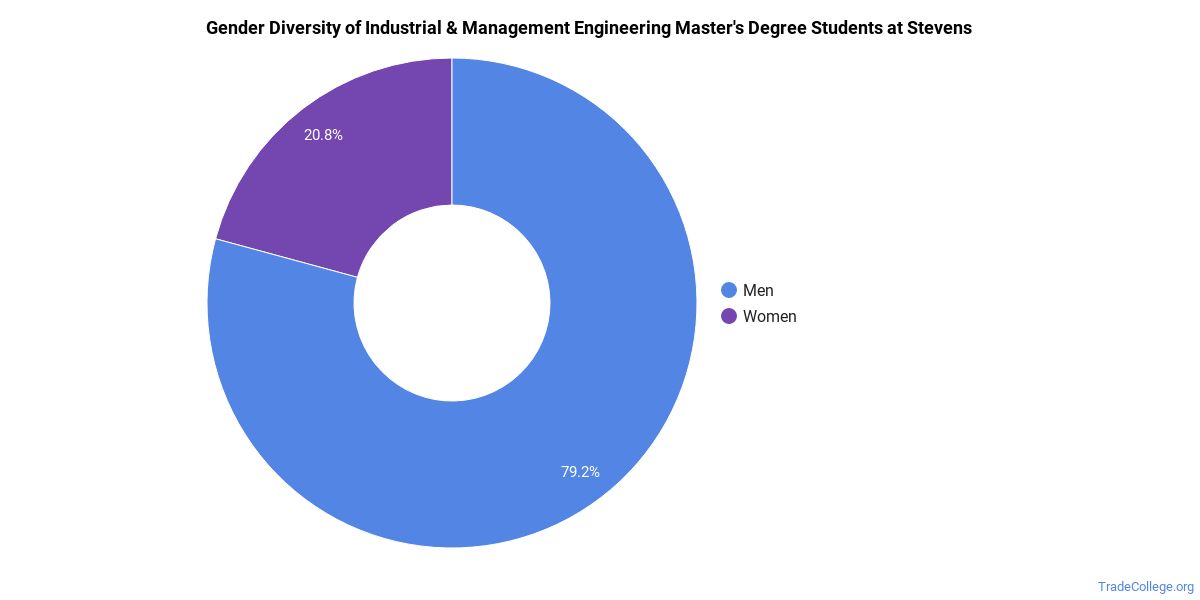
Industrial & Management Engineering Master’s Program at Stevens Institute of Technology
Among the 148 master’s industrial & management engineering graduates at Stevens Institute of Technology, 31% were women (46) and 69% were men (102).
The following table and chart show the race/ethnicity of Industrial & Management Engineering master’s degree recipients at Stevens Institute of Technology.
| Race / Ethnicity | Number of Graduates |
|---|---|
| White | 12 |
| Hispanic / Latino | 3 |
| Black / African American | 3 |
| Asian | 7 |
| Two or More Races | 1 |
| International (Nonresident) | 109 |
| Unknown | 13 |
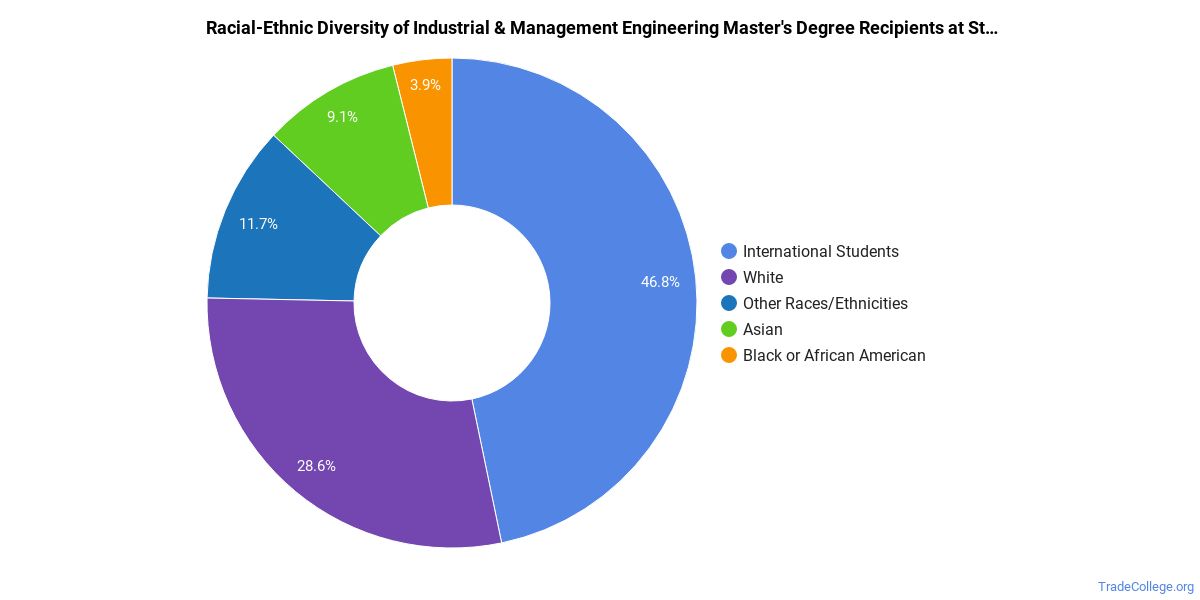
Racial-ethnic minorities make up 9% of Industrial & Management Engineering master’s degree recipients at Stevens Institute of Technology, below the national average of 17%.*
Industrial & Management Engineering Doctoral Program at Stevens Institute of Technology
Of the 1 doctoral industrial & management engineering degrees awarded at Stevens Institute of Technology, 100% were women (1) and 0% were men (0).

The following table and chart show the race/ethnicity of Industrial & Management Engineering doctoral degree recipients at Stevens Institute of Technology.
| Race / Ethnicity | Number of Graduates |
|---|---|
| International (Nonresident) | 1 |

*The racial-ethnic minorities figure is the total number of graduates minus White, international (nonresident), and unknown-race graduates.
Best-Paid Careers for Industrial & Management Engineering Graduates
Students who finish Industrial & Management Engineering program at Stevens Institute of Technology pursue many career paths. Below are the top-paying careers for Industrial & Management Engineering graduates, ordered by median annual salary:
| Occupation | Nationwide Median Wage |
|---|---|
| Nanotechnology Engineering Technologists and Technicians | $88,689 |
| Industrial Engineering Technologists and Technicians | $50,036 |
References
- IPEDS — Integrated Postsecondary Education Data System
- U.S. Department of Education — College Scorecard
- O*NET Online (Bureau of Labor Statistics)
- National Center for Education Statistics
More about our data sources and methodologies.
TradeCollege.org provides higher-education, college and university, degree, program, career, salary, and other helpful information to students, faculty, institutions, and other internet audiences. Presented information and data are subject to change. Inclusion on this website does not imply or represent a direct relationship with the company, school, or brand. Information, though believed correct at time of publication, may not be correct, and no warranty is provided. Contact the schools to verify any information before relying on it. Financial aid may be available for those who qualify. TradeCollege.org is a for-profit site, and the displayed options may include sponsored or recommended results, not necessarily based on your preferences.
© TradeCollege.org – All Rights Reserved.