Find Trade Colleges
Industrial & Management Engineering at Stanford University
If you plan to study Industrial & Management Engineering, you may want to check out the program at Stanford University. The following information will help you decide if it is a good fit for you.
Stanford University is in Stanford, CA.
For the most recent IPEDS reporting year, 206 industrial & management engineering graduations were recorded at Stanford University.
Studying Online at Stanford University
Online coursework is an option at Stanford University. Of 18,625 students, 350 (2%) studied exclusively online and 854 (5%) took at least some classes online.
Industrial & Management Engineering Rankings at Stanford University
Rankings can help you compare Stanford University’s Industrial & Management Engineering program against peer institutions.
Bachelor’s-Level Rankings
| Ranking | Scope | Rank |
|---|---|---|
| Best Value | California | #3 of 8 |
| Best Value | Far Western (Region) | #3 of 12 |
| Best Schools (Quality) | California | #5 of 8 |
| Best Schools (Quality) | Far Western (Region) | #7 of 12 |
| Best Value | Nationwide | #11 of 118 |
| Best Schools (Quality) | Nationwide | #31 of 118 |
Student Demographics & Diversity
The following sections describe the diversity of Industrial & Management Engineering graduates at Stanford University, broken down by degree level.
Program-wide, Industrial & Management Engineering graduates at Stanford University are 45% women (92) and 55% men (114).
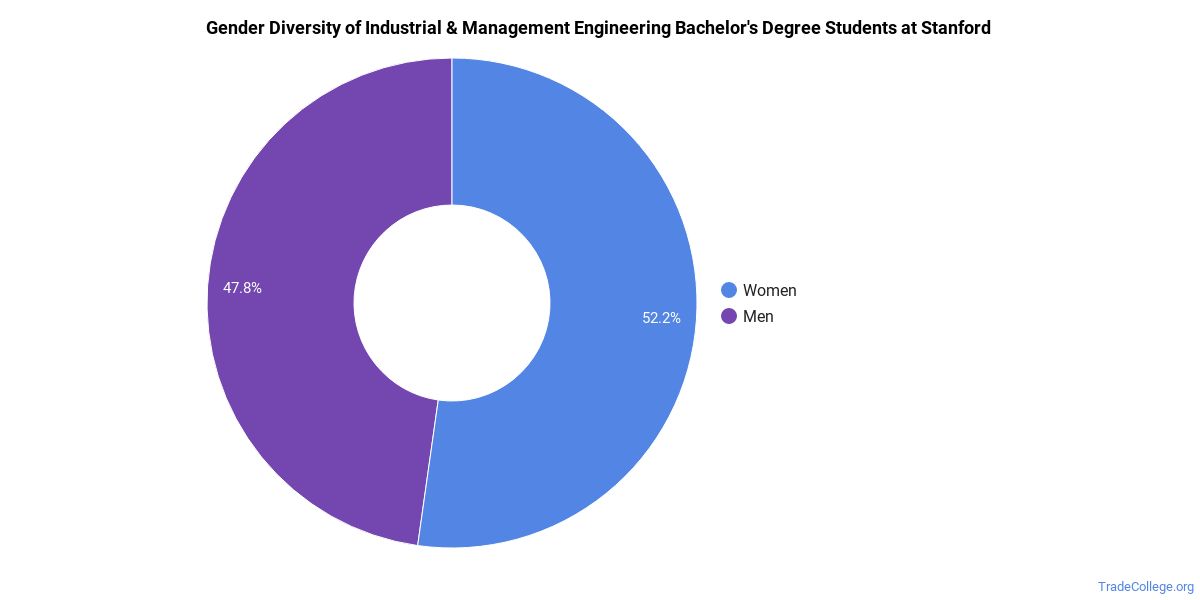
Industrial & Management Engineering Bachelor’s Program at Stanford University
Among the 63 bachelor’s industrial & management engineering degrees awarded at Stanford University, 43% were women (27) and 57% were men (36).
The following table and chart show the race/ethnicity of Industrial & Management Engineering bachelor’s degree recipients at Stanford University.
| Race / Ethnicity | Number of Graduates |
|---|---|
| White | 23 |
| Hispanic / Latino | 8 |
| Black / African American | 2 |
| Asian | 19 |
| Two or More Races | 4 |
| International (Nonresident) | 7 |
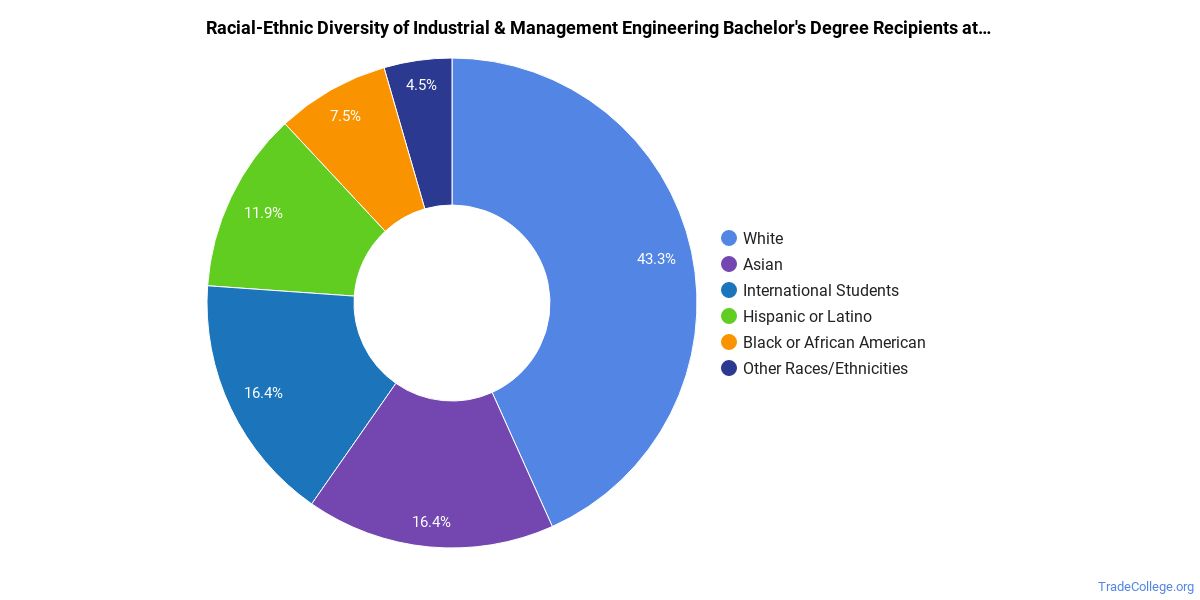
Racial-ethnic minorities make up 52% of Industrial & Management Engineering bachelor’s degree recipients at Stanford University, higher than the national average of 28%.*
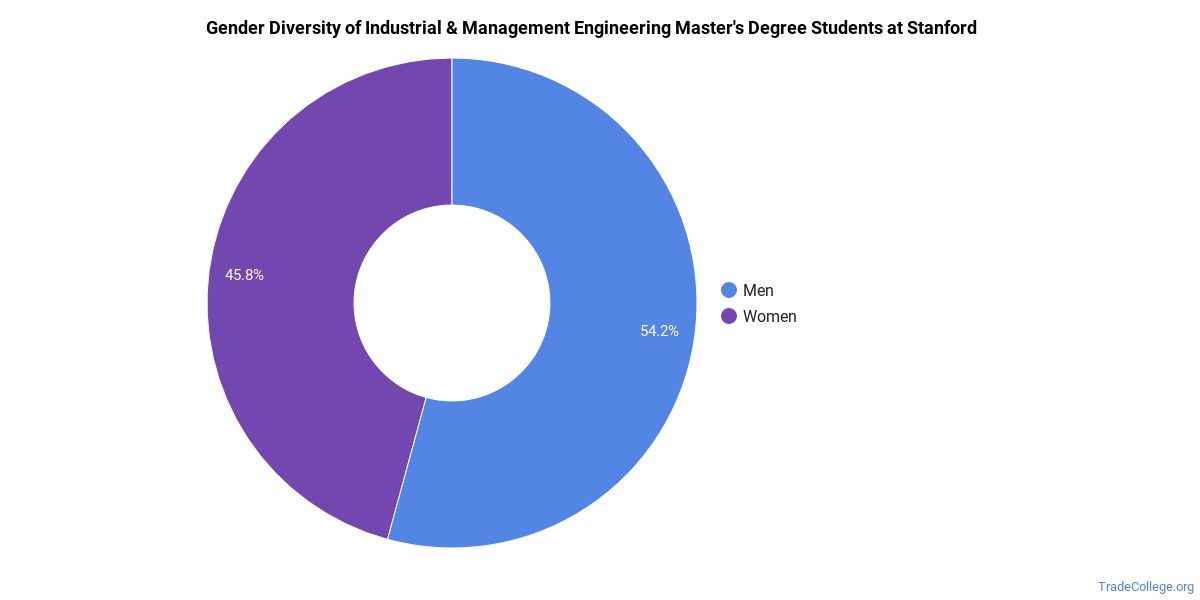
Industrial & Management Engineering Master’s Program at Stanford University
Among the 127 master’s industrial & management engineering degrees awarded at Stanford University, 46% were women (58) and 54% were men (69).
The following table and chart show the race/ethnicity of Industrial & Management Engineering master’s degree recipients at Stanford University.
| Race / Ethnicity | Number of Graduates |
|---|---|
| White | 20 |
| Hispanic / Latino | 6 |
| Black / African American | 9 |
| Asian | 30 |
| Two or More Races | 6 |
| International (Nonresident) | 54 |
| Unknown | 2 |
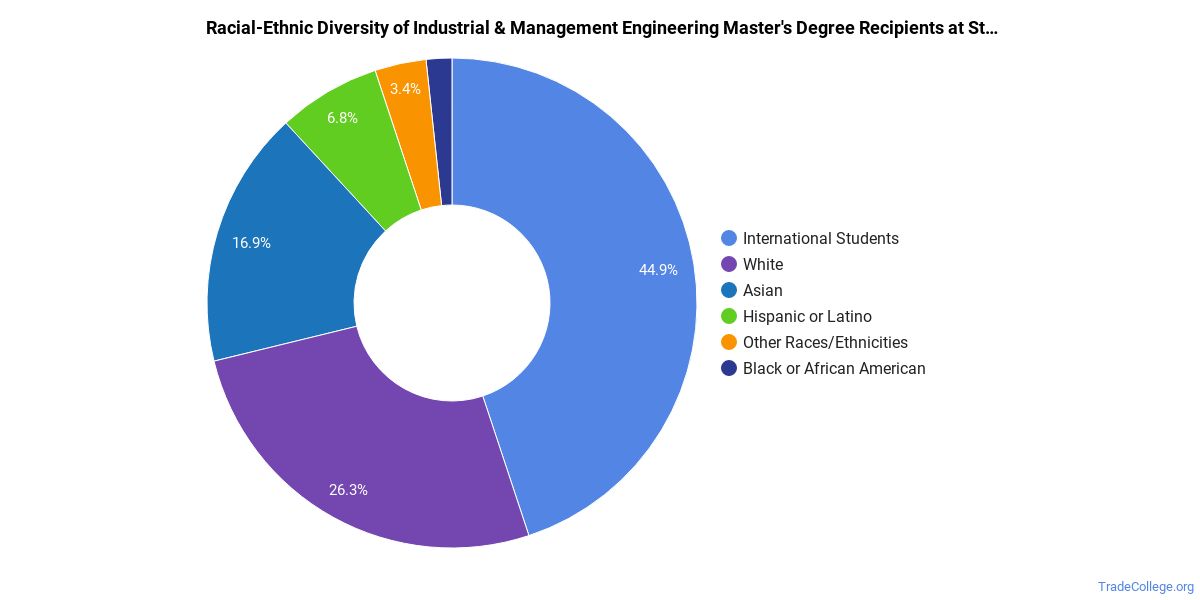
Racial-ethnic minorities make up 40% of Industrial & Management Engineering master’s degree recipients at Stanford University, above the national average of 17%.*
Industrial & Management Engineering Doctoral Program at Stanford University
Among the 16 doctoral industrial & management engineering graduates at Stanford University, 44% were women (7) and 56% were men (9).

The following table and chart show the race/ethnicity of Industrial & Management Engineering doctoral degree recipients at Stanford University.
| Race / Ethnicity | Number of Graduates |
|---|---|
| White | 6 |
| Asian | 2 |
| International (Nonresident) | 8 |

Racial-ethnic minorities make up 12% of Industrial & Management Engineering doctoral degree recipients at Stanford University, higher than the national average of 7%.*
*The racial-ethnic minorities figure is the total number of graduates minus White, international (nonresident), and unknown-race graduates.
Highest-Paying Careers for Industrial & Management Engineering Graduates
Graduates of the Industrial & Management Engineering program at Stanford University pursue many career paths. Below are the best-paid careers for Industrial & Management Engineering majors, ordered by median annual salary:
| Occupation | Nationwide Median Wage |
|---|---|
| Nanotechnology Engineering Technologists and Technicians | $88,689 |
| Industrial Engineering Technologists and Technicians | $50,036 |
References
- IPEDS — Integrated Postsecondary Education Data System
- U.S. Department of Education — College Scorecard
- O*NET Online (Bureau of Labor Statistics)
- National Center for Education Statistics
More about our data sources and methodologies.
TradeCollege.org provides higher-education, college and university, degree, program, career, salary, and other helpful information to students, faculty, institutions, and other internet audiences. Presented information and data are subject to change. Inclusion on this website does not imply or represent a direct relationship with the company, school, or brand. Information, though believed correct at time of publication, may not be correct, and no warranty is provided. Contact the schools to verify any information before relying on it. Financial aid may be available for those who qualify. TradeCollege.org is a for-profit site, and the displayed options may include sponsored or recommended results, not necessarily based on your preferences.
© TradeCollege.org – All Rights Reserved.