Find Trade Colleges
San Diego Mesa College Trade Programs
San Diego Mesa College is a public institution located in San Diego, California. San Diego is a great location for students who prefer city over country life.
Featured schools near , edit
Where Is San Diego Mesa College?
Contact details for San Diego Mesa College are given below.
| Contact Details | |
|---|---|
| Address: | 7250 Mesa College Dr, San Diego, CA 92111-4998 |
| Phone: | 619-388-2600 |
| Website: | www.sdmesa.edu |
Can I Afford San Diego Mesa College?
| In State | Out of State | |
|---|---|---|
| Tuition | $1,104 | $9,048 |
| Fees | $46 | $46 |
| Books and Supplies | $938 | $938 |
Student Loan Debt
While almost two-thirds of students nationwide take out loans to pay for college, the percentage may be quite different for the school you plan on attending. At San Diego Mesa College, approximately 2% of students took out student loans averaging $5,736 a year. That adds up to $22,944 over four years for those students.
San Diego Mesa College Undergraduate Student Diversity
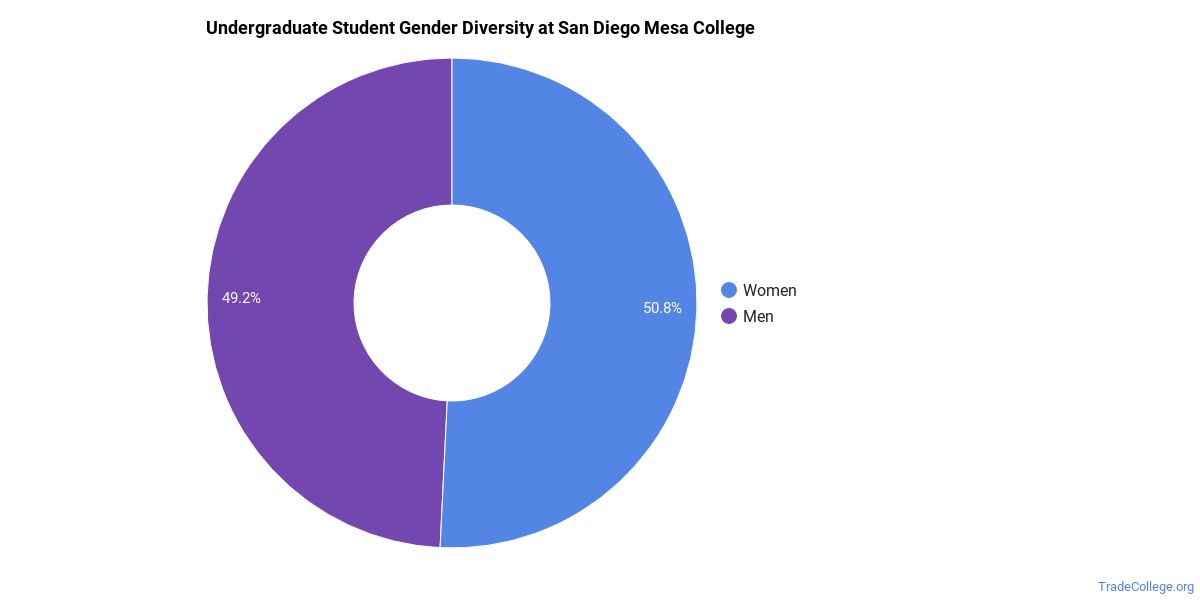
Gender Diversity
Of the 3,968 full-time undergraduates at San Diego Mesa College, 46% are male and 54% are female.
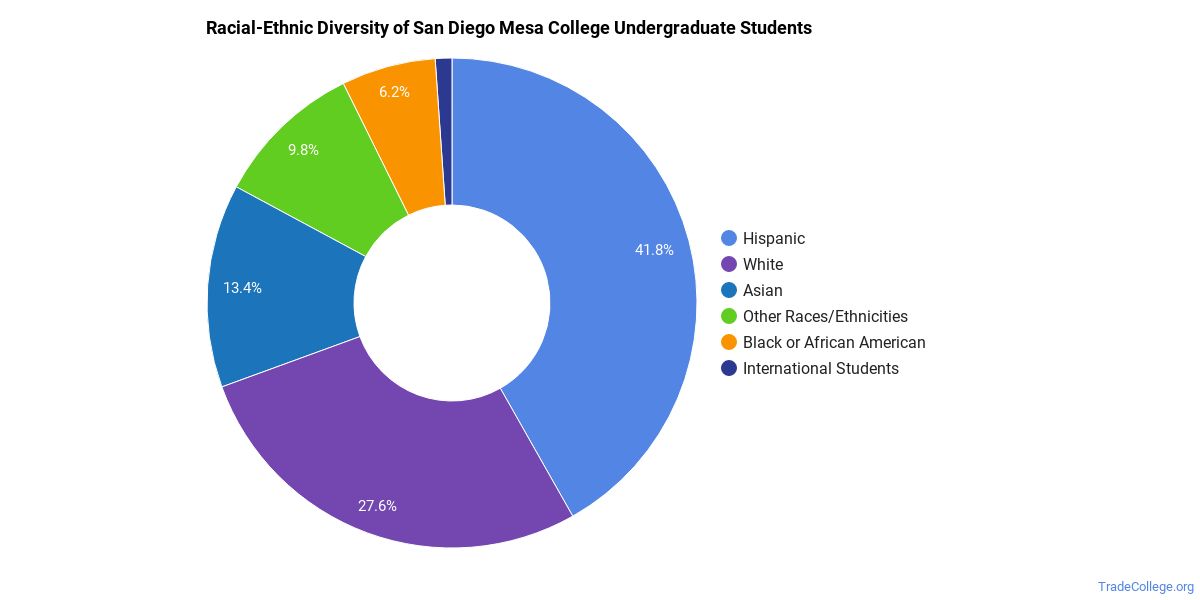
Racial-Ethnic Diversity
The racial-ethnic breakdown of San Diego Mesa College students is as follows.
| Race/Ethnicity | Number of Grads |
|---|---|
| Asian | 534 |
| Black or African American | 244 |
| Hispanic or Latino | 1,710 |
| White | 1,004 |
| International Students | 75 |
| Other Races/Ethnicities | 401 |
San Diego Mesa College Trade School Concentrations
The table below shows the number of awards for each concentration.
| Major | Basic Certificate | Associate’s | Undergraduate Certificate | Bachelor’s | TOTAL |
|---|---|---|---|---|---|
| Health Information/Medical Records Technology/Technician | 0 | 57 | 0 | 34 | 91 |
| Medical/Clinical Assistant | 7 | 20 | 0 | 0 | 27 |
| Radiologic Technology | 0 | 23 | 4 | 0 | 27 |
| Dental Assisting/Assistant | 0 | 5 | 16 | 0 | 21 |
| Physical Therapy Assistant | 0 | 19 | 0 | 0 | 19 |
| General Cooking & Related Culinary Arts | 0 | 8 | 6 | 0 | 14 |
| Building/Construction Site Management/Manager | 0 | 12 | 0 | 0 | 12 |
| Building/Home/Construction Inspection/Inspector | 1 | 4 | 0 | 0 | 5 |
| Medical Insurance Coding Specialist/Coder | 5 | 0 | 0 | 0 | 5 |
| Biomedical Technology | 0 | 1 | 0 | 0 | 1 |
| Other Dental Services & Allied Professions | 1 | 0 | 0 | 0 | 1 |
| Electroneurodiagnostic/Electroencephalographic Technology/Technologist | 0 | 0 | 0 | 0 | 0 |
| Health Information Management | 0 | 0 | 0 | 0 | 0 |
| TOTAL | 14 | 149 | 26 | 34 | 223 |
References
*The racial-ethnic minorities count is calculated by taking the total number of students and subtracting white students, international students, and students whose race/ethnicity was unknown. This number is then divided by the total number of students at the school to obtain the racial-ethnic minorities percentage.
More about our data sources and methodologies.
TradeCollege.org provides higher-education, college and university, degree, program, career, salary, and other helpful information to students, faculty, institutions, and other internet audiences. Presented information and data are subject to change. Inclusion on this website does not imply or represent a direct relationship with the company, school, or brand. Information, though believed correct at time of publication, may not be correct, and no warranty is provided. Contact the schools to verify any information before relying on it. Financial aid may be available for those who qualify. TradeCollege.org is a for-profit site, and the displayed options may include sponsored or recommended results, not necessarily based on your preferences.
© TradeCollege.org – All Rights Reserved.