Quinnipiac University Trade Programs
Quinnipiac University is a private not-for-profit institution situated in Hamden, Connecticut. Hamden is considered a suburb and offers tranquility and safety near the excitement of a city center.
Featured schools near , edit
Where Is Quinnipiac University?

Contact details for Quinnipiac are given below.
| Contact Details | |
|---|---|
| Address: | 275 Mt Carmel Ave, Hamden, CT 06518 |
| Phone: | 203-582-8200 |
| Website: | www.qu.edu |
Can I Afford Quinnipiac?
| In State | Out of State | |
|---|---|---|
| Tuition | $49,170 | $49,170 |
| Fees | $2,620 | $2,620 |
| Books and Supplies | $800 | $800 |
| On Campus Room and Board | $15,950 | $15,950 |
| On Campus Other Expenses | $2,000 | $2,000 |
Student Loan Debt
It's not uncommon for college students to take out loans to pay for school. In fact, almost 66% of students nationwide depend at least partially on loans. At Quinnipiac, approximately 63% of students took out student loans averaging $11,073 a year. That adds up to $44,292 over four years for those students.
The student loan default rate at Quinnipiac is 1.2%. This is significantly lower than the national default rate of 10.1%, which is a good sign that you'll be able to pay back your student loans.
Quinnipiac University Undergraduate Student Diversity

There are also 2,919 graduate students at the school.
Gender Diversity
Of the 5,985 full-time undergraduates at Quinnipiac, 38% are male and 62% are female.

Racial-Ethnic Diversity
The racial-ethnic breakdown of Quinnipiac University students is as follows.

| Race/Ethnicity | Number of Grads |
|---|---|
| Asian | 217 |
| Black or African American | 235 |
| Hispanic or Latino | 577 |
| White | 4,479 |
| International Students | 157 |
| Other Races/Ethnicities | 320 |
Geographic Diversity
Connecticut students aren't the only ones who study at Quinnipiac University. At this time, 30 states are represented by the student population at the school.
Over 52 countries are represented at Quinnipiac. The most popular countries sending students to the school are Saudi Arabia, Canada, and China.
Online Learning at Quinnipiac University
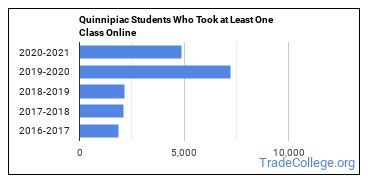
The following chart shows how the online learning population at Quinnipiac has changed over the last few years.

Online Growth Rankings of Quinnipiac
The average growth rate over the last four years of online students at Quinnipiac University was 8.5%. This is the #1,266 largest growth rate of all schools that are only partially online. This refers to all students at Quinnipiac regardless of major.
When we speak of partially online, we are referring to schools whose online population is less than 50% of its total student body. Mostly online refers to those with online populations greater than or equal to 50%.
References
*The racial-ethnic minorities count is calculated by taking the total number of students and subtracting white students, international students, and students whose race/ethnicity was unknown. This number is then divided by the total number of students at the school to obtain the racial-ethnic minorities percentage.
- College Factual
- National Center for Education Statistics
- Image Credit: By JlsElsewhere under License
More about our data sources and methodologies.
Featured Schools
 Request Info
|
Southern New Hampshire University You have goals. Southern New Hampshire University can help you get there. Whether you need a bachelor's degree to get into a career or want a master's degree to move up in your current career, SNHU has an online program for you. Find your degree from over 200 online programs. Learn More > |
