Find Trade Colleges
Pinellas Technical College-Clearwater Trade Programs
Pinellas Technical College-Clearwater is a public institution situated in Clearwater, Florida. Clearwater is a good match for students who enjoy the safety and convenience of the suburbs.
Featured schools near , edit
Where Is Pinellas Technical College-Clearwater?

Contact details for Pinellas Technical Education Center-Clearwater are given below.
| Contact Details | |
|---|---|
| Address: | 6100 154Th Avenue North, Clearwater, FL 33760-2140 |
| Phone: | 727-538-7167 |
| Website: | www.myptc.edu |
Pinellas Technical College-Clearwater Undergraduate Student Diversity
Gender Diversity
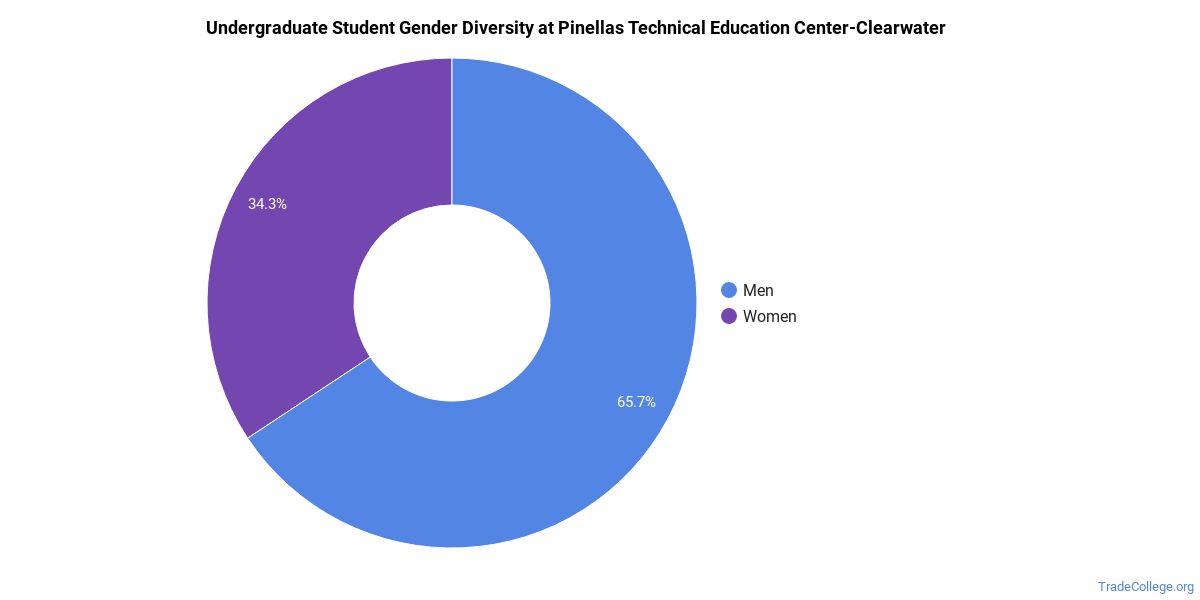
Of the 463 full-time undergraduates at Pinellas Technical Education Center-Clearwater, 70% are male and 30% are female.
Racial-Ethnic Diversity
The racial-ethnic breakdown of Pinellas Technical College-Clearwater students is as follows.

| Race/Ethnicity | Number of Grads |
|---|---|
| Asian | 13 |
| Black or African American | 76 |
| Hispanic or Latino | 73 |
| White | 280 |
| International Students | 3 |
| Other Races/Ethnicities | 18 |
Pinellas Technical College-Clearwater Trade School Concentrations
The table below shows the number of awards for each concentration.
| Major | Basic Certificate | Undergraduate Certificate | TOTAL |
|---|---|---|---|
| Licensed Practical/Vocational Nurse Training | 0 | 62 | 62 |
| Automobile/Automotive Mechanics Technology/Technician | 22 | 18 | 40 |
| Welding Technology/Welder | 8 | 22 | 30 |
| Electrician | 0 | 28 | 28 |
| Phlebotomy Technician/Phlebotomist | 20 | 0 | 20 |
| Baking & Pastry Arts/Baker/Pastry Chef | 19 | 0 | 19 |
| Machine Shop Technology/Assistant | 0 | 19 | 19 |
| Barbering/Barber | 0 | 13 | 13 |
| Medium/Heavy Vehicle & Truck Technology/Technician | 5 | 7 | 12 |
| Marine Maintenance/Fitter & Ship Repair Technology/Technician | 0 | 9 | 9 |
| General Cosmetology/Cosmetologist | 0 | 9 | 9 |
| Culinary Arts/Chef Training | 0 | 8 | 8 |
| Medical Administrative/Executive Assistant & Medical Secretary | 0 | 6 | 6 |
| Cabinetmaking & Millwork | 0 | 5 | 5 |
| Heating, Air Conditioning, Ventilation & Refrigeration Maintenance Technology/Technician | 0 | 0 | 0 |
| TOTAL | 74 | 206 | 280 |
References
*The racial-ethnic minorities count is calculated by taking the total number of students and subtracting white students, international students, and students whose race/ethnicity was unknown. This number is then divided by the total number of students at the school to obtain the racial-ethnic minorities percentage.
More about our data sources and methodologies.
TradeCollege.org provides higher-education, college and university, degree, program, career, salary, and other helpful information to students, faculty, institutions, and other internet audiences. Presented information and data are subject to change. Inclusion on this website does not imply or represent a direct relationship with the company, school, or brand. Information, though believed correct at time of publication, may not be correct, and no warranty is provided. Contact the schools to verify any information before relying on it. Financial aid may be available for those who qualify. TradeCollege.org is a for-profit site, and the displayed options may include sponsored or recommended results, not necessarily based on your preferences.
© TradeCollege.org – All Rights Reserved.