Find Trade Colleges
Aviation Management & Operations at Ohio University-Main Campus
What traits are you looking for in a school for Aviation Management & Operations, you may want to check out the program at Ohio University-Main Campus. The following information will help you decide if it is a good fit for you.
Ohio University-Main Campus sits in Athens, OH.
For the most recent IPEDS reporting year, 18 aviation management & operations degrees were awarded at Ohio University-Main Campus.
Studying Online at Ohio University-Main Campus
Many students take online classes at Ohio University-Main Campus. Among 26,323 students, 6,865 (26%) were enrolled entirely in distance education and 9,651 (37%) took at least some classes online.
Aviation Management & Operations Rankings at Ohio University-Main Campus
Rankings can help you compare Ohio University-Main Campus’s Aviation Management & Operations program against peer institutions.
Bachelor’s-Level Rankings
| Ranking | Scope | Rank |
|---|---|---|
| Best Schools (Quality) | Ohio | #2 of 2 |
| Best Value | Ohio | #3 of 3 |
| Best Schools (Quality) | Great Lakes (Region) | #4 of 8 |
| Best Value | Great Lakes (Region) | #11 of 11 |
| Best Schools (Quality) | Nationwide | #13 of 38 |
| Best Value | Nationwide | #46 of 63 |
Student Demographics & Diversity
Below you’ll find the student demographics for Aviation Management & Operations graduates at Ohio University-Main Campus, broken down by degree level.
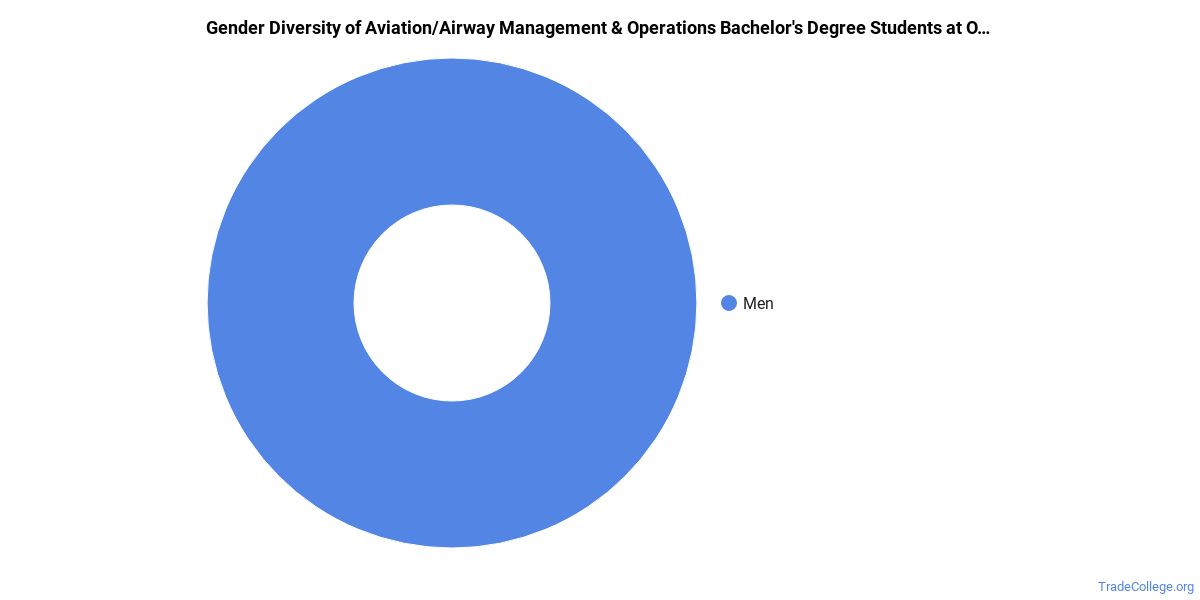
Program-wide, Aviation Management & Operations graduates at Ohio University-Main Campus are 28% women (5) and 72% men (13).
Aviation Management & Operations Bachelor’s Program at Ohio University-Main Campus
Among the 18 bachelor’s aviation management & operations degrees awarded at Ohio University-Main Campus, 28% were women (5) and 72% were men (13).
The following table and chart show the race/ethnicity of Aviation Management & Operations bachelor’s degree recipients at Ohio University-Main Campus.
| Race / Ethnicity | Number of Graduates |
|---|---|
| White | 13 |
| Hispanic / Latino | 1 |
| Black / African American | 1 |
| Asian | 1 |
| Native Hawaiian / Pacific Islander | 1 |
| International (Nonresident) | 1 |
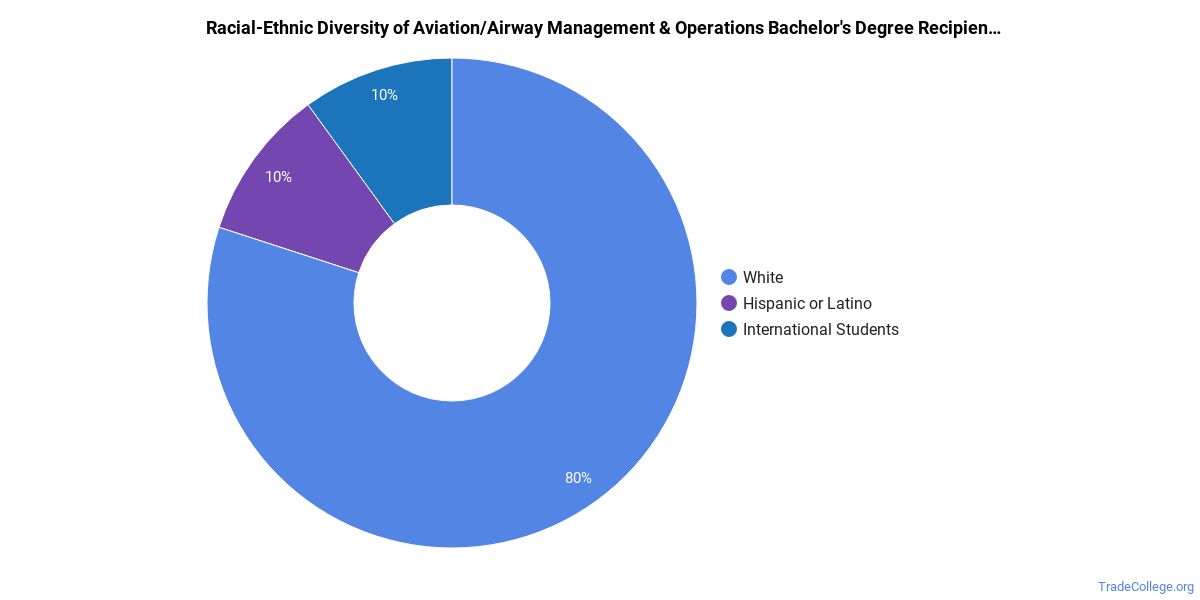
Minority students account for 22% of Aviation Management & Operations bachelor’s degree recipients at Ohio University-Main Campus, lower than the national average of 33%.*
*The racial-ethnic minorities figure is the total number of graduates minus White, international (nonresident), and unknown-race graduates.
References
- IPEDS — Integrated Postsecondary Education Data System
- U.S. Department of Education — College Scorecard
- O*NET Online (Bureau of Labor Statistics)
- National Center for Education Statistics
More about our data sources and methodologies.
TradeCollege.org provides higher-education, college and university, degree, program, career, salary, and other helpful information to students, faculty, institutions, and other internet audiences. Presented information and data are subject to change. Inclusion on this website does not imply or represent a direct relationship with the company, school, or brand. Information, though believed correct at time of publication, may not be correct, and no warranty is provided. Contact the schools to verify any information before relying on it. Financial aid may be available for those who qualify. TradeCollege.org is a for-profit site, and the displayed options may include sponsored or recommended results, not necessarily based on your preferences.
© TradeCollege.org – All Rights Reserved.