Find Trade Colleges
Northwestern College - Bridgeview Trade Programs
Northwestern College - Bridgeview is a private for-profit institution situated in Oak Lawn, Illinois. The suburban atmosphere of Oak Lawn makes it a great place for students who want the amenities of city life without actually living in the middle of a constant hustle and bustle.
Featured schools near , edit
Where Is Northwestern College - Bridgeview?
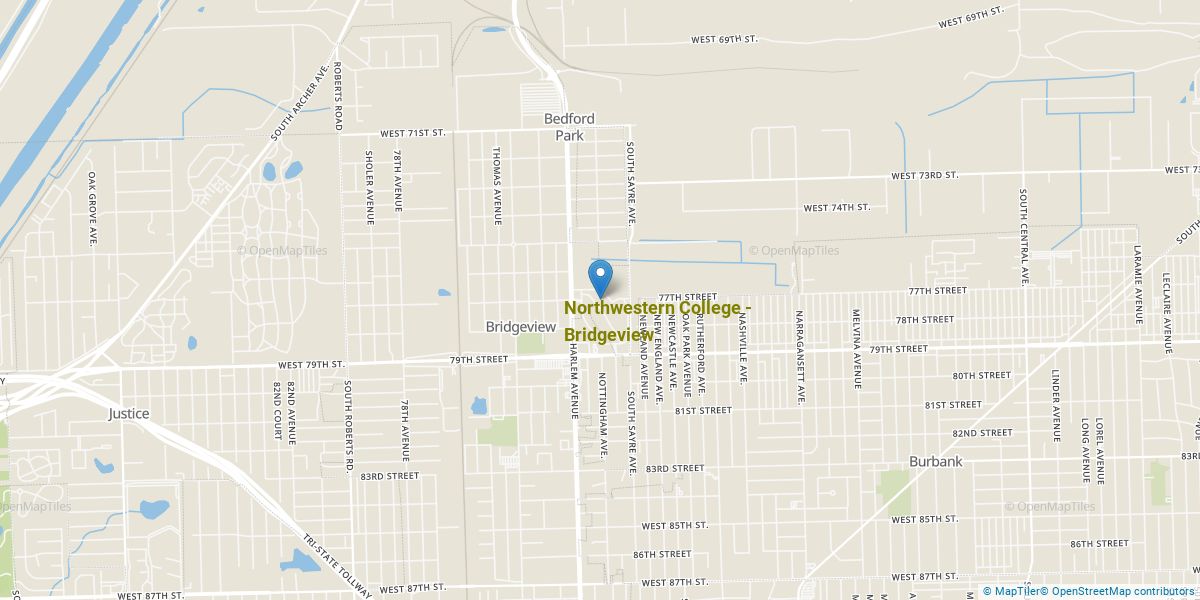
Contact details for NC are given below.
| Contact Details | |
|---|---|
| Address: | 9400 S Cicero Ave., Oak Lawn, IL 60453 |
| Phone: | 708-237-5050 |
| Website: | www.nc.edu |
Can I Afford NC?
| In State | Out of State | |
|---|---|---|
| Tuition | $18,280 | $18,280 |
| Fees | $195 | $195 |
| Books and Supplies | $1,548 | $1,548 |
Student Loan Debt
Almost 66% of college students who graduated with the class of 2018 took out student loans, but that percentage varies from school to school. At NC, approximately 86% of students took out student loans averaging $2,970 a year. That adds up to $11,880 over four years for those students.
Northwestern College - Bridgeview Undergraduate Student Diversity
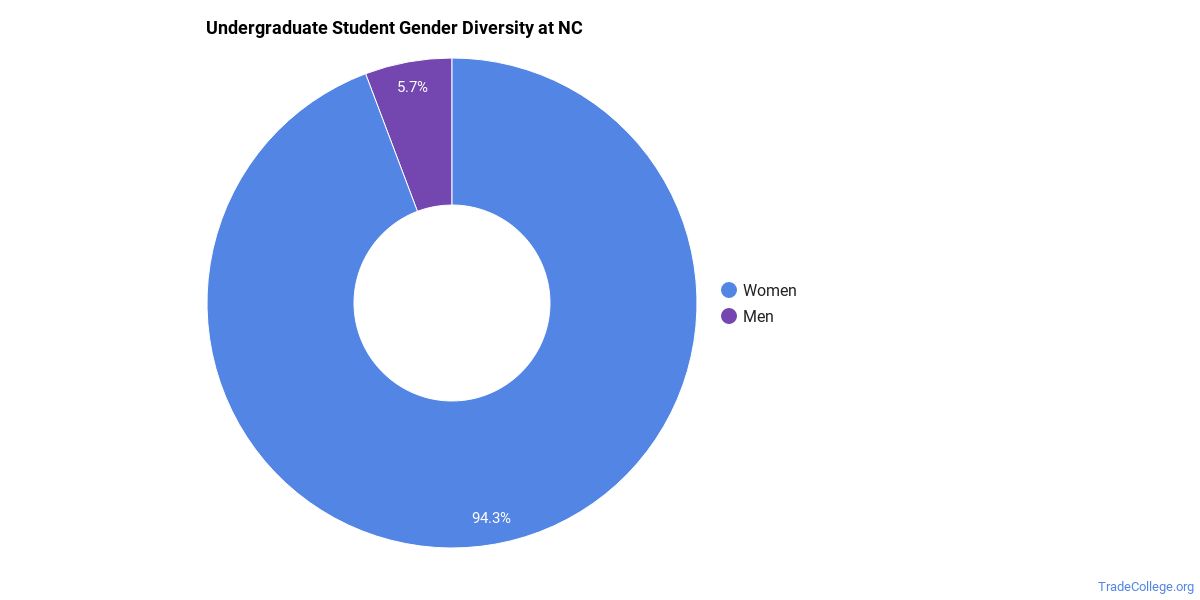
Gender Diversity
Of the 203 full-time undergraduates at NC, 9% are male and 91% are female.
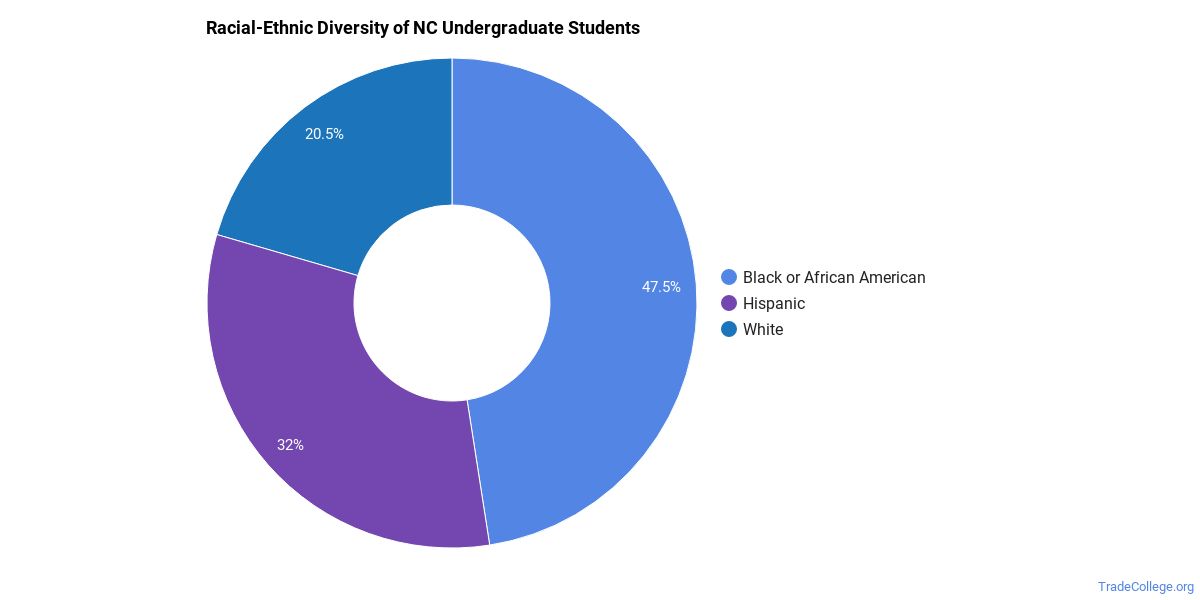
Racial-Ethnic Diversity
The racial-ethnic breakdown of Northwestern College - Bridgeview students is as follows.
| Race/Ethnicity | Number of Grads |
|---|---|
| Asian | 5 |
| Black or African American | 93 |
| Hispanic or Latino | 56 |
| White | 45 |
| International Students | 0 |
| Other Races/Ethnicities | 4 |
Northwestern College - Bridgeview Trade School Concentrations
The table below shows the number of awards for each concentration.
| Major | Associate’s | Undergraduate Certificate | TOTAL |
|---|---|---|---|
| Dental Assisting/Assistant | 0 | 19 | 19 |
| Medical/Clinical Assistant | 0 | 17 | 17 |
| Radiologic Technology | 12 | 0 | 12 |
| Health Information/Medical Records Technology/Technician | 11 | 0 | 11 |
| Medical Insurance Coding Specialist/Coder | 0 | 0 | 0 |
| TOTAL | 23 | 36 | 59 |
References
*The racial-ethnic minorities count is calculated by taking the total number of students and subtracting white students, international students, and students whose race/ethnicity was unknown. This number is then divided by the total number of students at the school to obtain the racial-ethnic minorities percentage.
More about our data sources and methodologies.
TradeCollege.org provides higher-education, college and university, degree, program, career, salary, and other helpful information to students, faculty, institutions, and other internet audiences. Presented information and data are subject to change. Inclusion on this website does not imply or represent a direct relationship with the company, school, or brand. Information, though believed correct at time of publication, may not be correct, and no warranty is provided. Contact the schools to verify any information before relying on it. Financial aid may be available for those who qualify. TradeCollege.org is a for-profit site, and the displayed options may include sponsored or recommended results, not necessarily based on your preferences.
© TradeCollege.org – All Rights Reserved.