Linfield University - McMinnville Campus Trade Programs
Linfield University - McMinnville Campus is a private not-for-profit institution located in McMinnville, Oregon. The location of Linfield is a good match for students who are interested in living in a college town while they pursue their degree.
Featured schools near , edit
Where Is Linfield University - McMinnville Campus?
Contact details for Linfield are given below.
| Contact Details | |
|---|---|
| Address: | 900 Se Baker, McMinnville, OR 97128-6894 |
| Phone: | 503-883-2200 |
| Website: | www.linfield.edu |
| Facebook: | https://www.facebook.com/pages/Linfield-College-Adult-Degree-Program/356325706747 |
| Twitter: | https://twitter.com/linfieldpdx |
Can I Afford Linfield?
| In State | Out of State | |
|---|---|---|
| Tuition | $45,340 | $45,340 |
| Fees | $692 | $692 |
| Books and Supplies | $1,000 | $1,000 |
| On Campus Room and Board | $13,200 | $13,200 |
| On Campus Other Expenses | $1,950 | $1,950 |
Student Loan Debt
It's not uncommon for college students to take out loans to pay for school. In fact, almost 66% of students nationwide depend at least partially on loans. At Linfield, approximately 70% of students took out student loans averaging $9,161 a year. That adds up to $36,644 over four years for those students.
The student loan default rate at Linfield is 2.1%. This is significantly lower than the national default rate of 10.1%, which is a good sign that you'll be able to pay back your student loans.
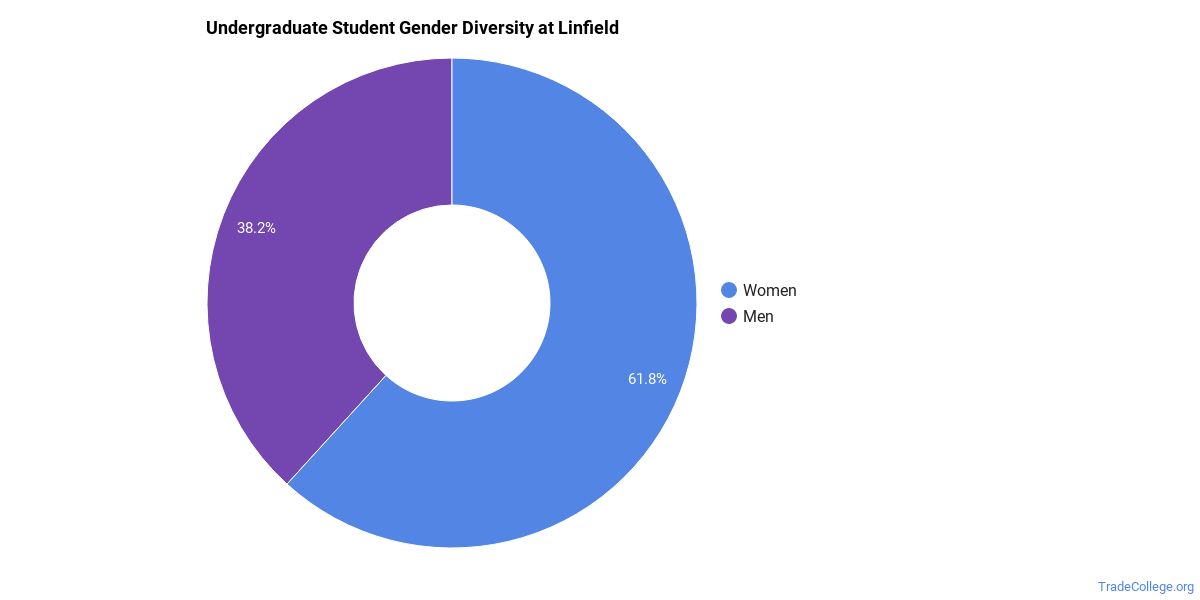
Linfield University - McMinnville Campus Undergraduate Student Diversity
Gender Diversity
Of the 1,365 full-time undergraduates at Linfield, 38% are male and 62% are female.
Racial-Ethnic Diversity
The racial-ethnic breakdown of Linfield University - McMinnville Campus students is as follows.
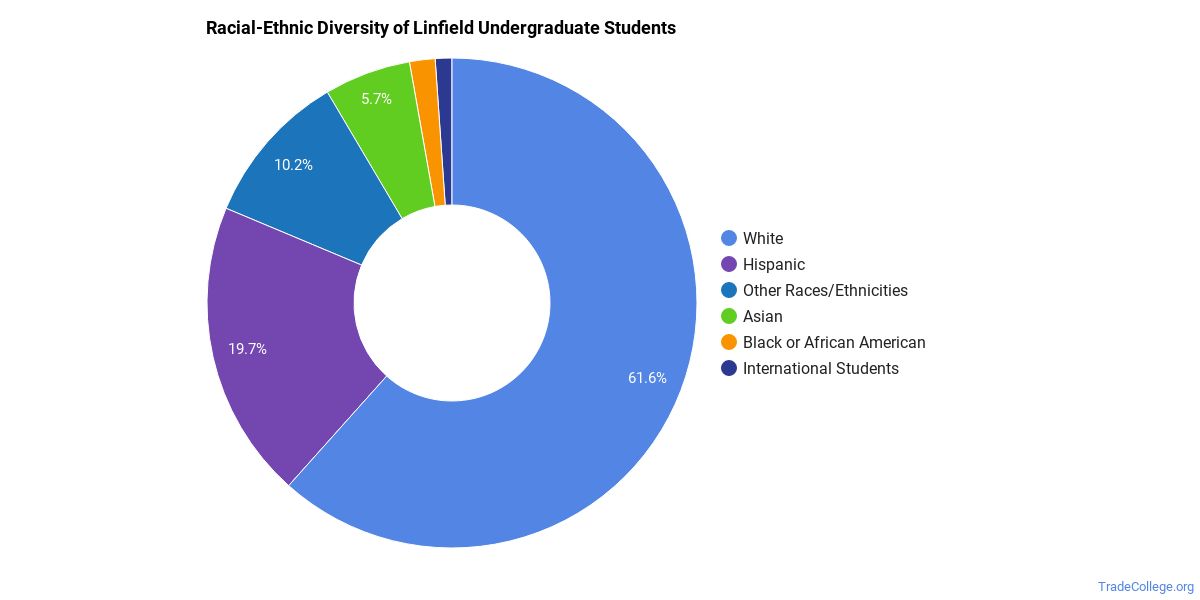
| Race/Ethnicity | Number of Grads |
|---|---|
| Asian | 78 |
| Black or African American | 23 |
| Hispanic or Latino | 269 |
| White | 841 |
| International Students | 15 |
| Other Races/Ethnicities | 139 |
Geographic Diversity
Oregon students aren't the only ones who study at Linfield University - McMinnville Campus. At this time, 14 states are represented by the student population at the school.
Over 24 countries are represented at Linfield. The most popular countries sending students to the school are China, Malaysia, and Vietnam.
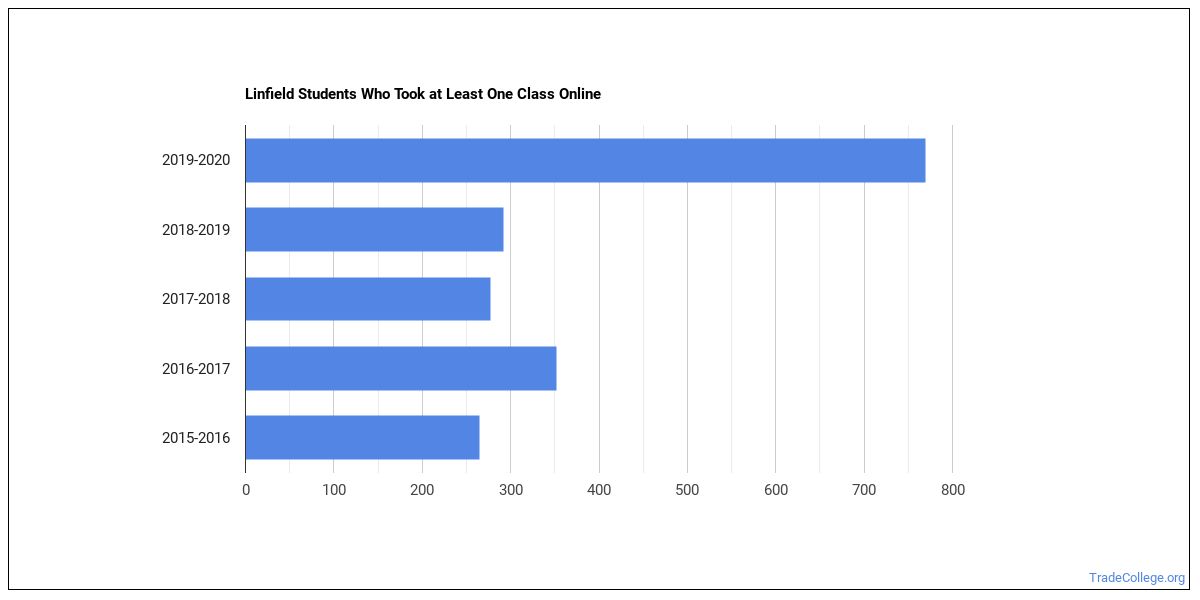
Online Learning at Linfield University - McMinnville Campus
The following chart shows how the online learning population at Linfield has changed over the last few years.
Online Growth Rankings of Linfield
The average growth rate over the last four years of online students at Linfield University - McMinnville Campus was 351.7%. This is the #152 largest growth rate of all schools that are only partially online. This refers to all students at Linfield regardless of major.
When we speak of partially online, we are referring to schools whose online population is less than 50% of its total student body. Mostly online refers to those with online populations greater than or equal to 50%.
Linfield University - McMinnville Campus Trade School Concentrations
The table below shows the number of awards for each concentration.
| Major | Bachelor’s | TOTAL |
|---|---|---|
| Athletic Training | 6 | 6 |
| TOTAL | 6 | 6 |
References
*The racial-ethnic minorities count is calculated by taking the total number of students and subtracting white students, international students, and students whose race/ethnicity was unknown. This number is then divided by the total number of students at the school to obtain the racial-ethnic minorities percentage.
- College Factual
- National Center for Education Statistics
- Image Credit: By Visitor7 under License
More about our data sources and methodologies.
Featured Schools
 Request Info
|
Southern New Hampshire University You have goals. Southern New Hampshire University can help you get there. Whether you need a bachelor's degree to get into a career or want a master's degree to move up in your current career, SNHU has an online program for you. Find your degree from over 200 online programs. Learn More > |
TradeCollege.org provides higher-education, college and university, degree, program, career, salary, and other helpful information to students, faculty, institutions, and other internet audiences. Presented information and data are subject to change. Inclusion on this website does not imply or represent a direct relationship with the company, school, or brand. Information, though believed correct at time of publication, may not be correct, and no warranty is provided. Contact the schools to verify any information before relying on it. Financial aid may be available for those who qualify. TradeCollege.org is a for-profit site, and the displayed options may include sponsored or recommended results, not necessarily based on your preferences.
© TradeCollege.org – All Rights Reserved.