Find Trade Colleges
Lehigh Carbon Community College Trade Programs
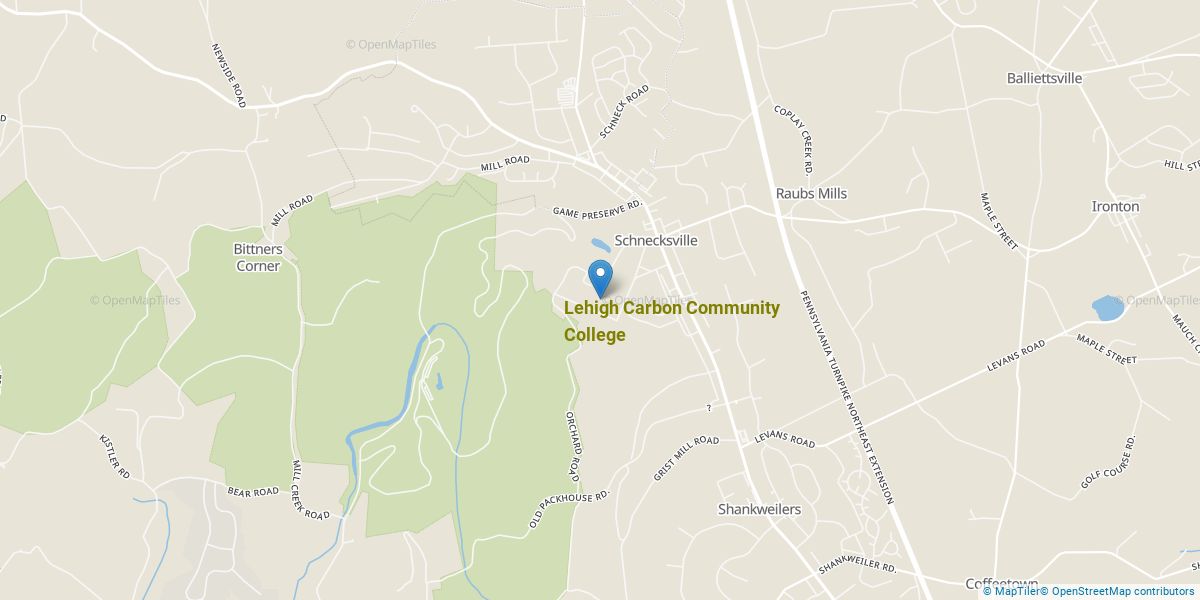
Lehigh Carbon Community College is a public institution located in Schnecksville, PA. A Rural Area Near Urban Centers provides tranquility and safety close to urban amenities.
Where Is Lehigh Carbon Community College?
Contact information for LCCC can be found below.
| Contact Details | |
|---|---|
| Address: | 4525 Education Park Dr, Schnecksville, PA 18078-2598 |
| Phone: | 6107992121 |
| Website: | www.lccc.edu/ |
| Admissions: | www.lccc.edu/admissions |
| Financial Aid: | www.lccc.edu/tuition-financial-aid |
How Do I Get Into LCCC?
You can apply to LCCC online at: https://www.lccc.edu/admissions/how-to-become-a-student/new-students-registration
How Hard Is It To Get Into LCCC?
Average Test Scores
Can I Afford Lehigh Carbon Community College?
The average net price after aid at LCCC is $9,568. Cost varies significantly based on your financial situation since net price varies by income group.
Tuition & Fees
| Category | Cost |
|---|---|
| In-State Tuition | $3,750 |
| In-State Fees | $1,530 |
| Out-of-State Tuition | $11,250 |
| Out-of-State Fees | $2,020 |
| Total In-State Tuition & Fees | $5,280 |
| Total Out-of-State Tuition & Fees | $13,270 |
Financial Aid
Across all aid types, 12% of students at LCCC receive some form of financial aid (747 students).
About 43% of students at LCCC receive grant or scholarship aid, averaging $6,164 per student.
34% of students receive federal Pell Grants, averaging $6,156.
Student Loan Debt
21% of LCCC undergraduates take out federal student loans, averaging $6,591 per year.
Lehigh Carbon Community College Undergraduate Student Diversity
Its Carnegie Classification is Associate’s Colleges: Mixed Transfer/Career & Technical-Mixed Traditional/Nontraditional.
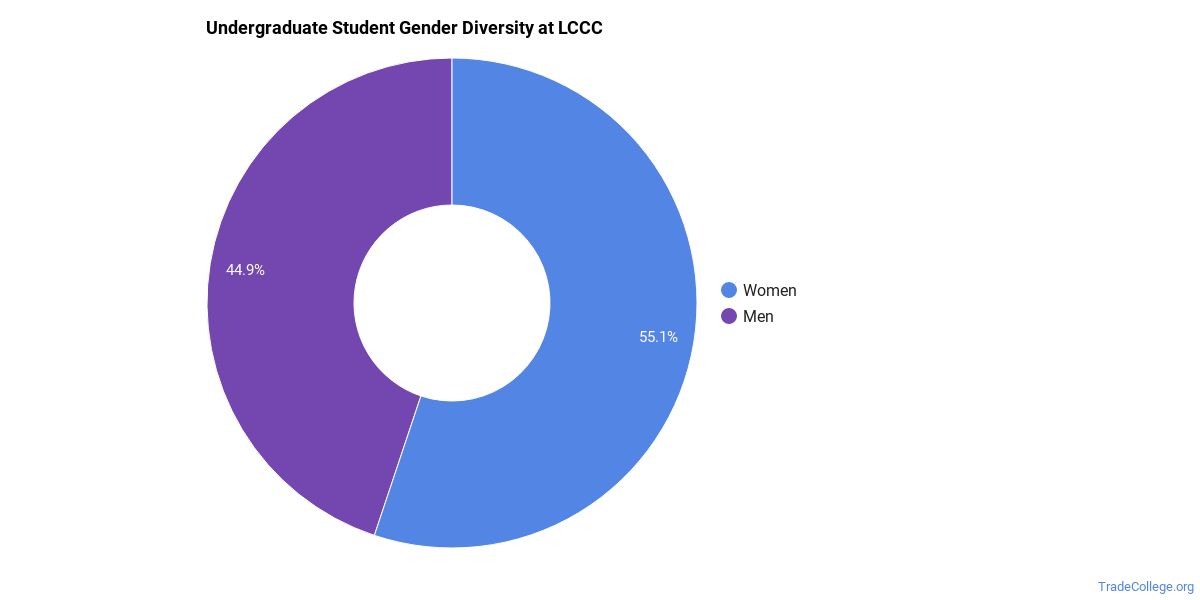
Gender Diversity
Of the 4,465 undergraduate students at LCCC, approximately 36% are male and 64% are female.
Racial-Ethnic Diversity
The racial-ethnic breakdown of Lehigh Carbon Community College undergraduate students is as follows.
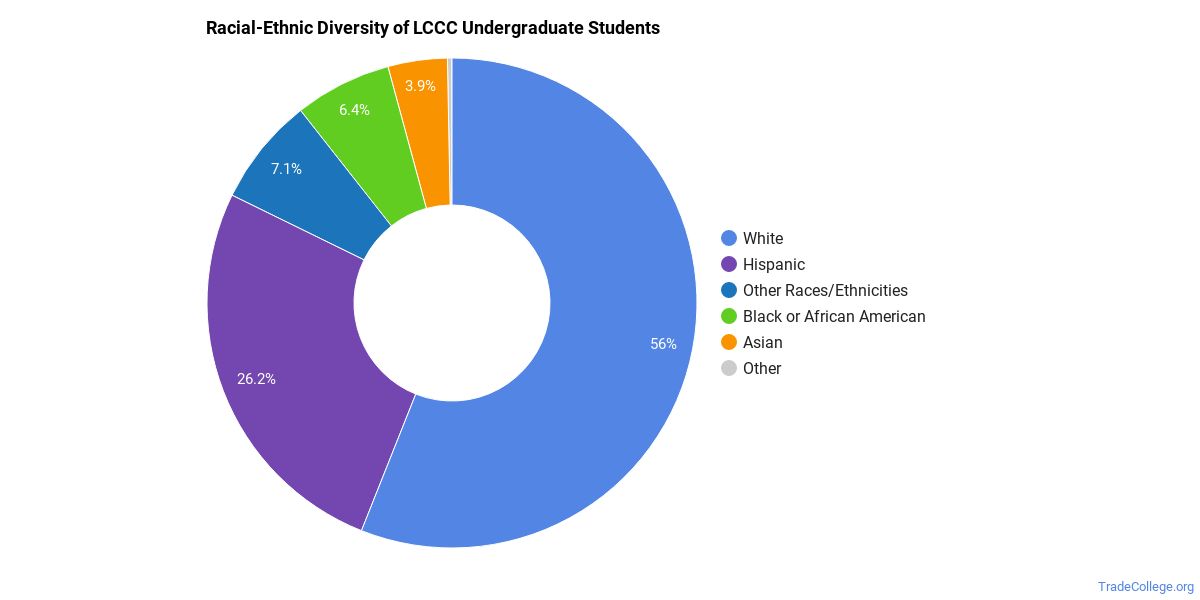
| Race/Ethnicity | Number of Students |
|---|---|
| Asian | 156 |
| Black or African American | 339 |
| Hispanic | 1,357 |
| White | 2,295 |
| American Indian/Alaska Native | 31 |
| Native Hawaiian/Pacific Islander | 8 |
| Two or More Races | 107 |
| Non-Resident | 8 |
Geographic Diversity
The top 5 home states of first-time undergraduate students at LCCC are shown below.

| State | First-Time UG Students |
|---|---|
| Pennsylvania | 1,178 |
| New Jersey | 2 |
| Florida | 1 |
| New York | 1 |
Additionally, approximately 0.2% of undergraduate students are non-resident from outside the United States.
Online Learning at Lehigh Carbon Community College
LCCC offers remote learning paths for students who need flexibility.
1,810 undergraduate students at LCCC took at least one online class — of those, 1,816 took all of their classes online.
Distance education is available at the undergraduate level.
Trade Programs at Lehigh Carbon Community College
The following trade majors are available at LCCC, with per-level degree counts in the most recent reporting year.
| Program | Bachelor’s | Master’s | Doctorate | Total |
|---|---|---|---|---|
| Culinary Arts and Related Services | — | — | — | 2 |
Academic Programs at Lehigh Carbon Community College
LCCC offers 27 distinct academic programs.
The highest level of award offered is Associate’s degree.
Institutional Profile
LCCC has an open admission policy: Yes. Credit transfer:
- AP credits: Yes
- Dual enrollment credits: Yes
- Life experience credits: Implied no
References
More about our data sources and methodologies.
TradeCollege.org provides higher-education, college and university, degree, program, career, salary, and other helpful information to students, faculty, institutions, and other internet audiences. Presented information and data are subject to change. Inclusion on this website does not imply or represent a direct relationship with the company, school, or brand. Information, though believed correct at time of publication, may not be correct, and no warranty is provided. Contact the schools to verify any information before relying on it. Financial aid may be available for those who qualify. TradeCollege.org is a for-profit site, and the displayed options may include sponsored or recommended results, not necessarily based on your preferences.
© TradeCollege.org – All Rights Reserved.