Find Trade Colleges
Herzing University - Kenner Trade Programs
Herzing University - Kenner is a private not-for-profit institution situated in Metairie, Louisiana. The city atmosphere of Metairie makes it a great place for students who enjoy having lots of educational and entertainment options.
Featured schools near , edit
Where Is Herzing University - Kenner?
Contact details for Herzing University - Kenner are given below.
| Contact Details | |
|---|---|
| Address: | 3900 N. Causeway Blvd., Metairie, LA 70002 |
| Phone: | 504-733-0074 |
| Website: | www.herzing.edu |
Can I Afford Herzing University - Kenner?
| In State | Out of State | |
|---|---|---|
| Tuition | $12,360 | $12,360 |
| Fees | $1,060 | $1,060 |
Student Loan Debt
While almost two-thirds of students nationwide take out loans to pay for college, the percentage may be quite different for the school you plan on attending. At Herzing University - Kenner, approximately 85% of students took out student loans averaging $9,396 a year. That adds up to $37,584 over four years for those students.
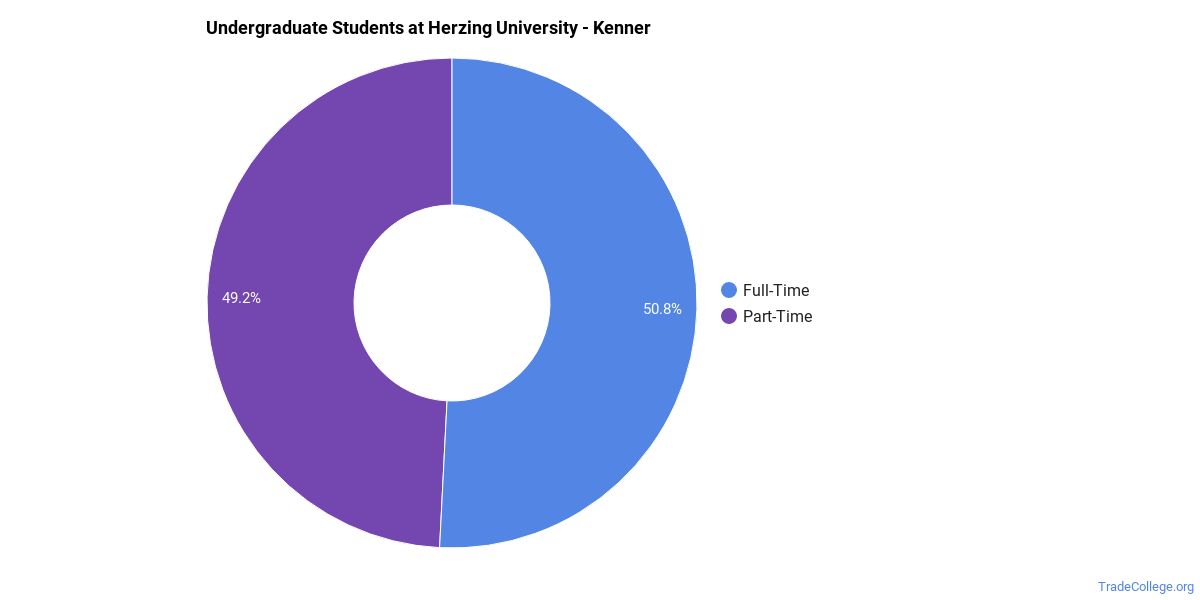
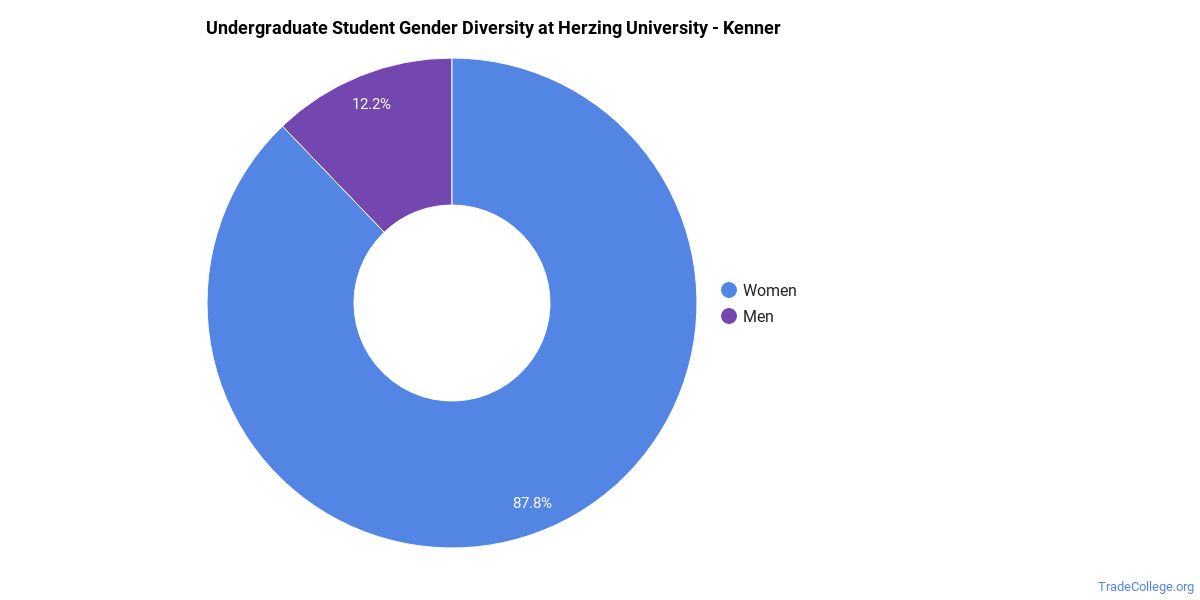
Herzing University - Kenner Undergraduate Student Diversity
There are also 19 graduate students at the school.
Gender Diversity
Of the 238 full-time undergraduates at Herzing University - Kenner, 11% are male and 89% are female.
Racial-Ethnic Diversity
The racial-ethnic breakdown of Herzing University - Kenner students is as follows.
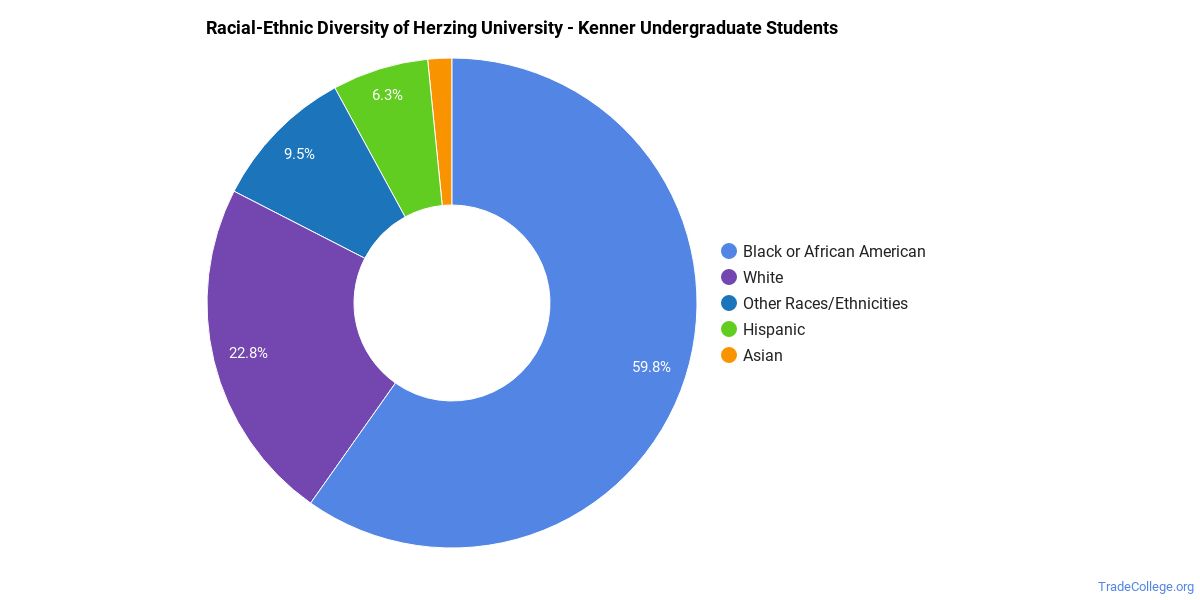
| Race/Ethnicity | Number of Grads |
|---|---|
| Asian | 2 |
| Black or African American | 130 |
| Hispanic or Latino | 20 |
| White | 63 |
| International Students | 0 |
| Other Races/Ethnicities | 23 |
Herzing University - Kenner Trade School Concentrations
The table below shows the number of awards for each concentration.
| Major | Associate’s | Bachelor’s | TOTAL |
|---|---|---|---|
| Surgical Technology | 26 | 0 | 26 |
| Medical Insurance Coding Specialist/Coder | 15 | 0 | 15 |
| Health Care Management | 0 | 7 | 7 |
| General Health & Wellness | 0 | 7 | 7 |
| Medical/Clinical Assistant | 6 | 0 | 6 |
| Health Information Management | 5 | 1 | 6 |
| Medical Office Management/Administration | 2 | 0 | 2 |
| TOTAL | 54 | 15 | 69 |
References
*The racial-ethnic minorities count is calculated by taking the total number of students and subtracting white students, international students, and students whose race/ethnicity was unknown. This number is then divided by the total number of students at the school to obtain the racial-ethnic minorities percentage.
More about our data sources and methodologies.
TradeCollege.org provides higher-education, college and university, degree, program, career, salary, and other helpful information to students, faculty, institutions, and other internet audiences. Presented information and data are subject to change. Inclusion on this website does not imply or represent a direct relationship with the company, school, or brand. Information, though believed correct at time of publication, may not be correct, and no warranty is provided. Contact the schools to verify any information before relying on it. Financial aid may be available for those who qualify. TradeCollege.org is a for-profit site, and the displayed options may include sponsored or recommended results, not necessarily based on your preferences.
© TradeCollege.org – All Rights Reserved.