Find Trade Colleges
Health & Medical Administrative Services at Cuyahoga Community College District
Cuyahoga Community College District is located in Cleveland, Ohio and has a total student population of 18,754. During the the most recent year for which data is available, 16 students received their associate's degree in health and medical administrative services.
Want to know more about the career opportunities in this field? Check out the Careers in Health & Medical Administrative Services section at the bottom of this page.
Featured schools near , edit
Cuyahoga Community College District Health & Medical Administrative Services Degrees Available
- Basic Certificate in Health & Medical Administrative Services (Less Than 1 Year)
- Undergrad Certificate in Health & Medical Administrative Services (1 - 4 Years)
- Associate’s Degree in Health & Medical Administrative Services
Cuyahoga Community College District Health & Medical Administrative Services Rankings
Note: Although rankings can help you see some information about a school, it's not a good idea to depend on them alone. Be sure to check out other things about the school before making your decision to attend.
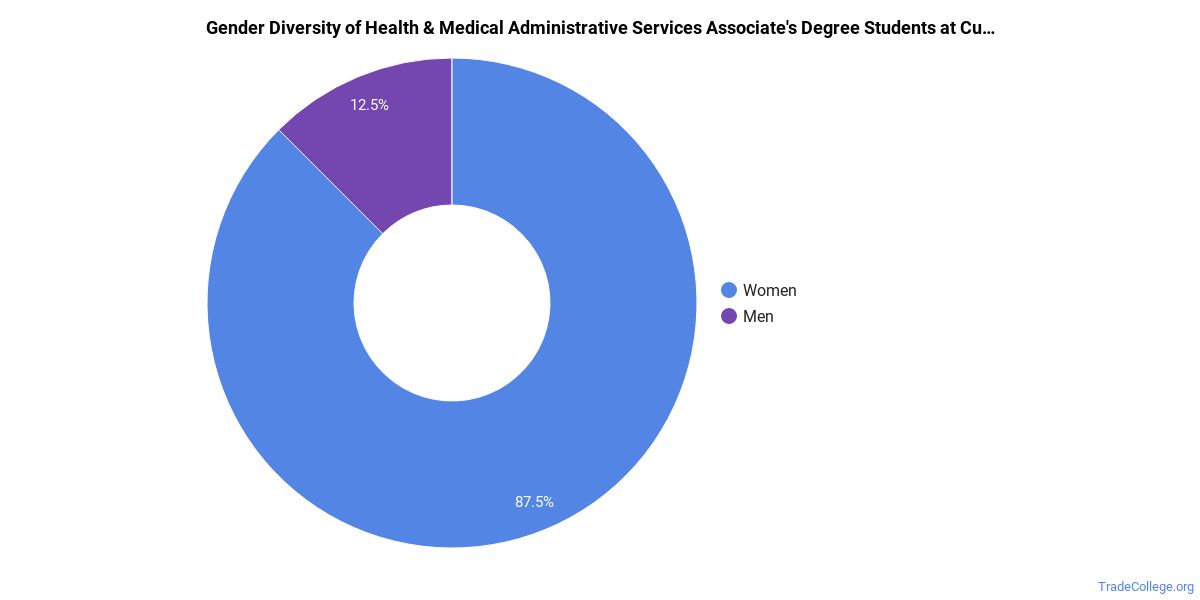
Health & Medical Administrative Services Student Demographics at Cuyahoga Community College District
Take a look at the following statistics related to the make-up of the health and medical administrative services majors at Cuyahoga Community College District.
Cuyahoga Community College District Health & Medical Administrative Services Associate’s Program
The following table and chart show the race/ethnicity for students who recently graduated from Cuyahoga Community College District with a associate's in health and medical administrative services.
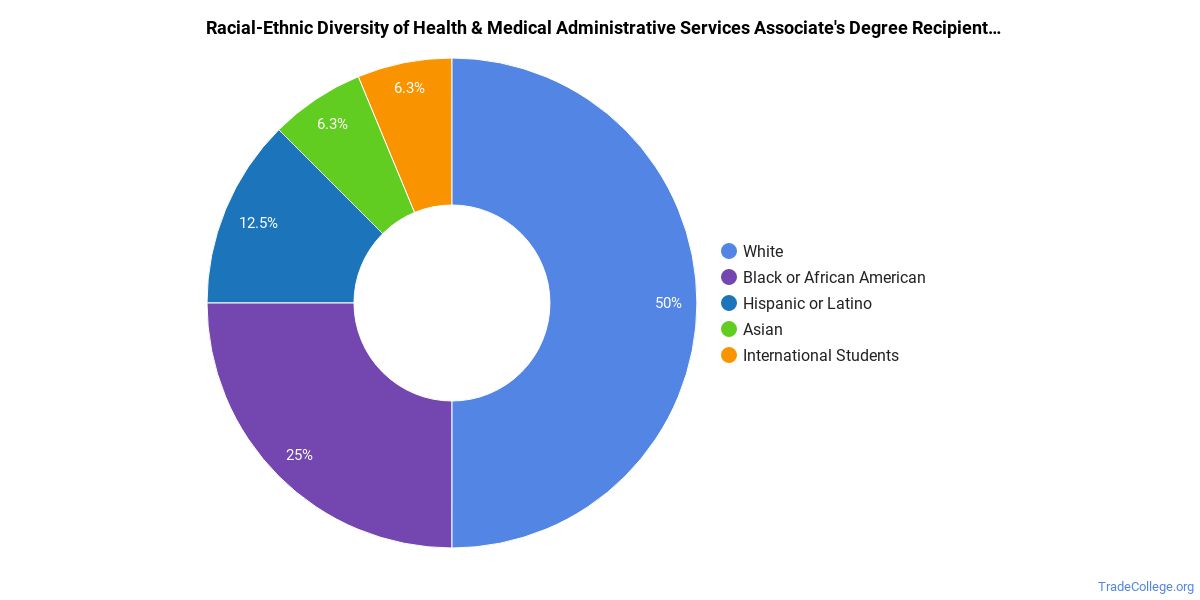
| Race/Ethnicity | Number of Students |
|---|---|
| Asian | 1 |
| Black or African American | 4 |
| Hispanic or Latino | 2 |
| White | 8 |
| International Students | 1 |
| Other Races/Ethnicities | 0 |
Concentrations Within Health & Medical Administrative Services
The following health and medical administrative services concentations are available at Cuyahoga Community College District. The table shows all degrees awarded in this field awarded for all degree levels at Cuyahoga Community College District. A concentration may not be available for your level.
| Concentration | Annual Degrees Awarded |
|---|---|
| Medical Insurance Specialist/Medical Biller | 19 |
| Health Information/Medical Records Technology/Technician | 16 |
| Medical Administrative/Executive Assistant & Medical Secretary | 6 |
| Disease Registry Data Management | 4 |
Related Majors
- Ophthalmic & Optometric Support Services
- Dental Support Services
- Clinical/Medical Laboratory Science
- Mental & Social Health Services
- Practical Nursing & Nursing Assistants
Careers That Health & Medical Administrative Services Grads May Go Into
A degree in health and medical administrative services can lead to the following careers. Since job numbers and average salaries can vary by geographic location, we have only included the numbers for OH, the home state for Cuyahoga Community College District.
| Occupation | Jobs in OH | Average Salary in OH |
|---|---|---|
| Office and Administrative Support Worker Supervisors | 47,520 | $56,870 |
| Medical Secretaries | 32,010 | $34,450 |
| Medical Assistants | 23,930 | $31,900 |
| Computer User Support Specialists | 20,780 | $50,180 |
| Medical and Health Services Managers | 14,760 | $101,390 |
References
*The racial-ethnic minorities count is calculated by taking the total number of students and subtracting white students, international students, and students whose race/ethnicity was unknown. This number is then divided by the total number of students at the school to obtain the racial-ethnic minorities percentage.
More about our data sources and methodologies.
TradeCollege.org provides higher-education, college and university, degree, program, career, salary, and other helpful information to students, faculty, institutions, and other internet audiences. Presented information and data are subject to change. Inclusion on this website does not imply or represent a direct relationship with the company, school, or brand. Information, though believed correct at time of publication, may not be correct, and no warranty is provided. Contact the schools to verify any information before relying on it. Financial aid may be available for those who qualify. TradeCollege.org is a for-profit site, and the displayed options may include sponsored or recommended results, not necessarily based on your preferences.
© TradeCollege.org – All Rights Reserved.