Find Trade Colleges
Clark College Trade Programs
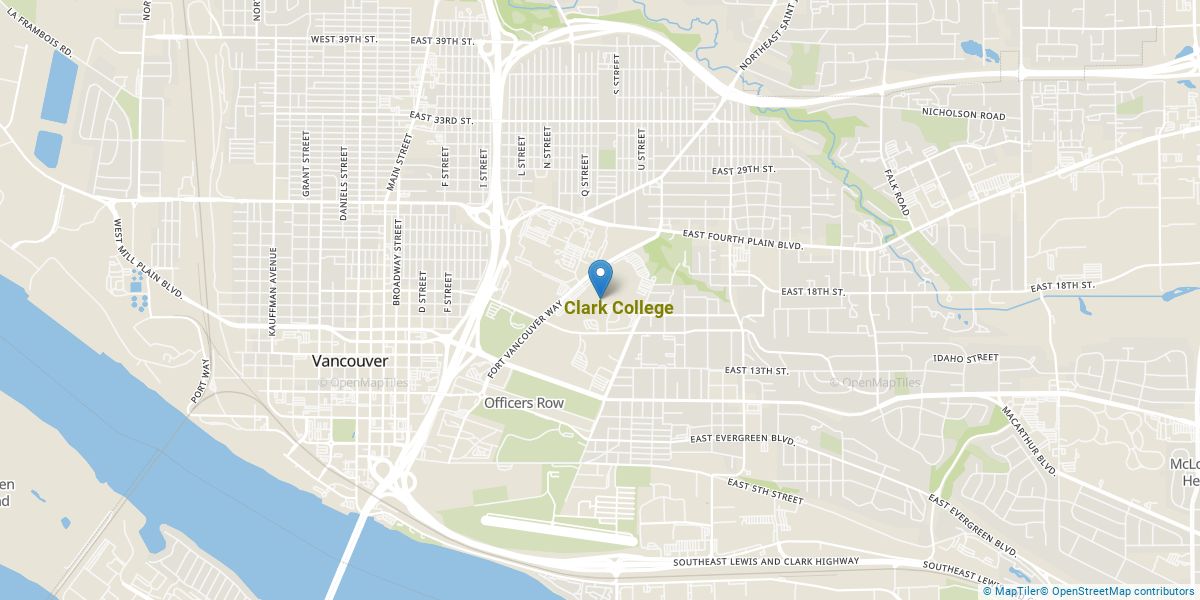
Clark College is a public institution situated in Vancouver, Washington. The location of Clark College is great for students who prefer living in an urban area.
Featured schools near , edit
Where Is Clark College?
Contact details for Clark College are given below.
| Contact Details | |
|---|---|
| Address: | 1933 Fort Vancouver Way, Vancouver, WA 98663-3598 |
| Phone: | 360-992-2000 |
| Website: | www.clark.edu |
Can I Afford Clark College?
| In State | Out of State | |
|---|---|---|
| Tuition | $4,306 | $10,054 |
| Fees | $326 | $326 |
| Books and Supplies | $762 | $762 |
Student Loan Debt
It's not uncommon for college students to take out loans to pay for school. In fact, almost 66% of students nationwide depend at least partially on loans. At Clark College, approximately 11% of students took out student loans averaging $4,951 a year. That adds up to $19,804 over four years for those students.
Clark College Undergraduate Student Diversity
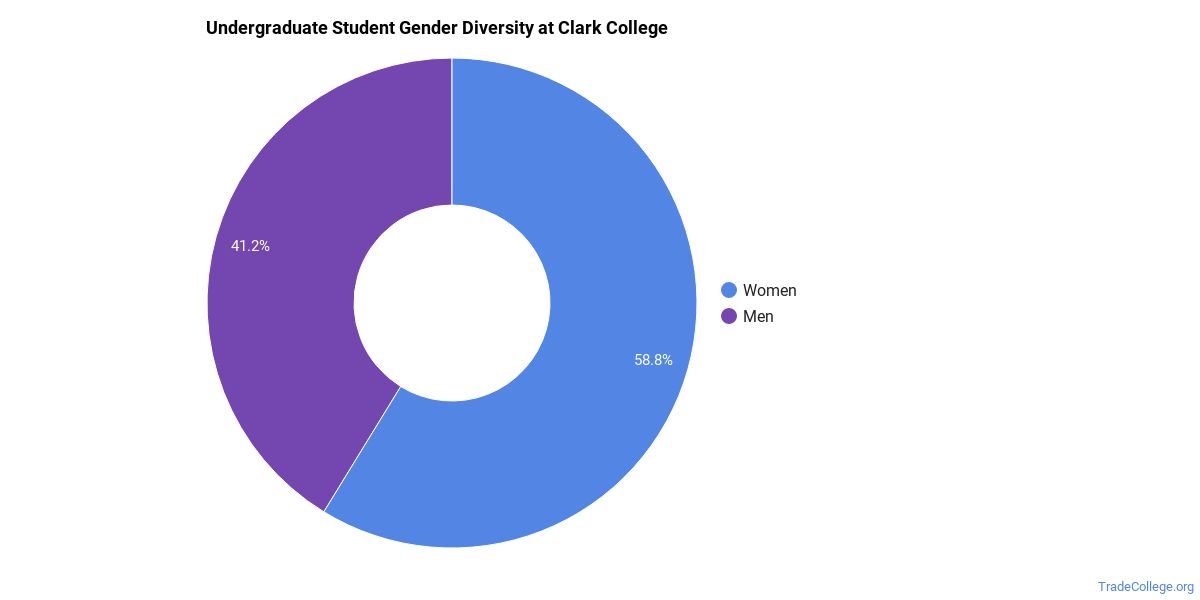
Gender Diversity
Of the 3,997 full-time undergraduates at Clark College, 40% are male and 60% are female.
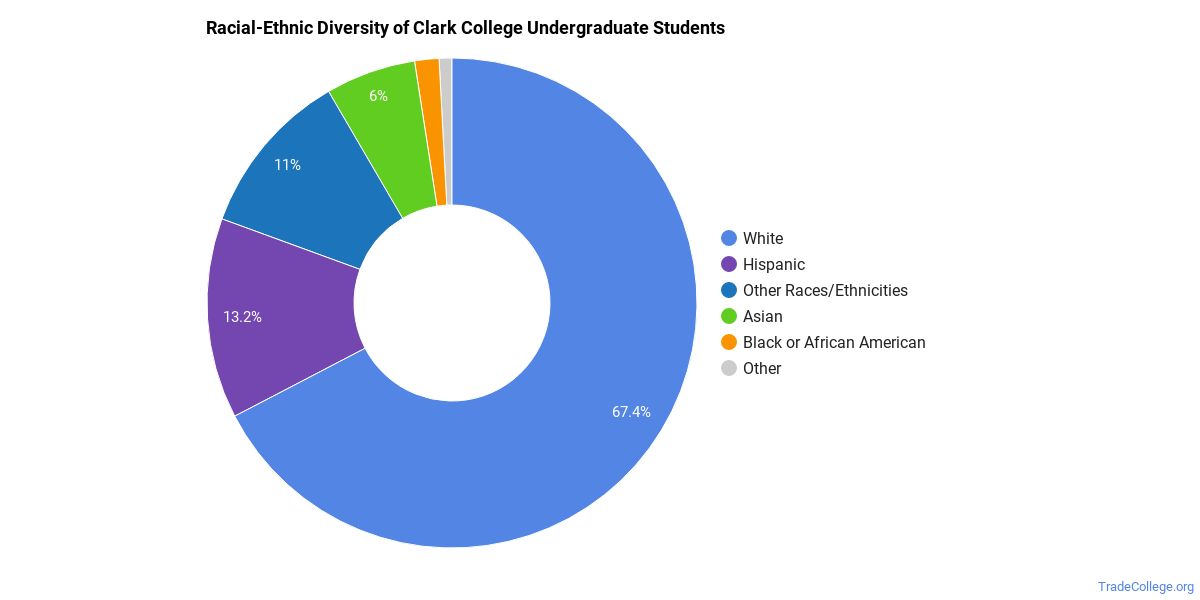
Racial-Ethnic Diversity
The racial-ethnic breakdown of Clark College students is as follows.
| Race/Ethnicity | Number of Grads |
|---|---|
| Asian | 232 |
| Black or African American | 63 |
| Hispanic or Latino | 466 |
| White | 2,678 |
| International Students | 37 |
| Other Races/Ethnicities | 521 |
Over 41 countries are represented at Clark College. The most popular countries sending students to the school are Vietnam, Japan, and China.
Clark College Trade School Concentrations
The table below shows the number of awards for each concentration.
References
*The racial-ethnic minorities count is calculated by taking the total number of students and subtracting white students, international students, and students whose race/ethnicity was unknown. This number is then divided by the total number of students at the school to obtain the racial-ethnic minorities percentage.
More about our data sources and methodologies.
TradeCollege.org provides higher-education, college and university, degree, program, career, salary, and other helpful information to students, faculty, institutions, and other internet audiences. Presented information and data are subject to change. Inclusion on this website does not imply or represent a direct relationship with the company, school, or brand. Information, though believed correct at time of publication, may not be correct, and no warranty is provided. Contact the schools to verify any information before relying on it. Financial aid may be available for those who qualify. TradeCollege.org is a for-profit site, and the displayed options may include sponsored or recommended results, not necessarily based on your preferences.
© TradeCollege.org – All Rights Reserved.