Find Trade Colleges
What is a Securities, Commodities, and Financial Services Sales Agent?
Securities, Commodities, & Financial Services Sales Agent Example Buy and sell securities or commodities in investment and trading firms, or provide financial services to businesses and individuals. May advise customers about stocks, bonds, mutual funds, commodities, and market conditions.
Featured schools near , edit
Related Job Titles for this Occupation:
- Stock Trader
- Equity Trader
- Securities Trader
- Municipal Bond Trader
- Commodity Trader
Securities, Commodities, & Financial Services Sales Agent Job Outlook
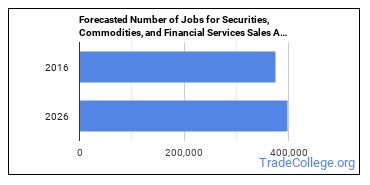
In the United States, there were 375,700 jobs for Securities, Commodities, and Financial Services Sales Agent in 2016. New jobs are being produced at a rate of 6.2% which is above the national average. The Bureau of Labor Statistics predicts 23,200 new jobs for Securities, Commodities, and Financial Services Sales Agent by 2026. The BLS estimates 38,000 yearly job openings in this field.

The states with the most job growth for Securities, Commodities, & Financial Services Sales Agent are Arizona, Utah, and Iowa. Watch out if you plan on working in Massachusetts, New Jersey, or Maine. These states have the worst job growth for this type of profession.
How Much Does a Securities, Commodities, & Financial Services Sales Agent Make?
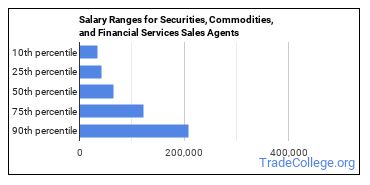
The salary for Securities, Commodities, and Financial Services Sales Agents ranges between about $34,360 and $208,000 a year.

Securities, Commodities, and Financial Services Sales Agents who work in New York, South Dakota, or Connecticut, make the highest salaries.
How much do Securities, Commodities, and Financial Services Sales Agents make in different U.S. states?
| State | Annual Mean Salary |
|---|---|
| Alabama | $82,810 |
| Alaska | $101,290 |
| Arizona | $72,750 |
| Arkansas | $74,490 |
| California | $81,610 |
| Colorado | $76,160 |
| Connecticut | $122,890 |
| Delaware | $87,390 |
| District of Columbia | $103,380 |
| Florida | $82,810 |
| Georgia | $77,000 |
| Hawaii | $85,660 |
| Idaho | $62,690 |
| Illinois | $91,640 |
| Indiana | $92,400 |
| Iowa | $75,380 |
| Kansas | $107,500 |
| Kentucky | $85,420 |
| Louisiana | $89,550 |
| Maine | $81,670 |
| Maryland | $97,570 |
| Massachusetts | $118,310 |
| Michigan | $79,320 |
| Minnesota | $104,570 |
| Mississippi | $78,220 |
| Missouri | $80,280 |
| Montana | $89,270 |
| Nebraska | $86,920 |
| Nevada | $70,480 |
| New Hampshire | $98,030 |
| New Jersey | $98,850 |
| New Mexico | $56,380 |
| New York | $161,580 |
| North Carolina | $88,810 |
| North Dakota | $100,060 |
| Ohio | $77,960 |
| Oklahoma | $78,220 |
| Oregon | $66,120 |
| Pennsylvania | $86,970 |
| Rhode Island | $100,390 |
| South Carolina | $75,120 |
| South Dakota | $113,460 |
| Tennessee | $75,610 |
| Texas | $85,720 |
| Utah | $71,460 |
| Vermont | $105,770 |
| Virginia | $90,410 |
| Washington | $79,930 |
| West Virginia | $83,930 |
| Wisconsin | $77,780 |
| Wyoming | $70,030 |
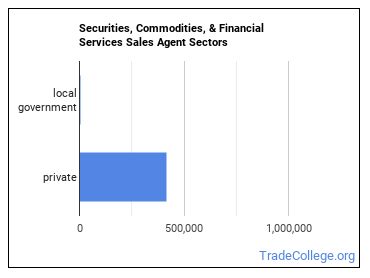
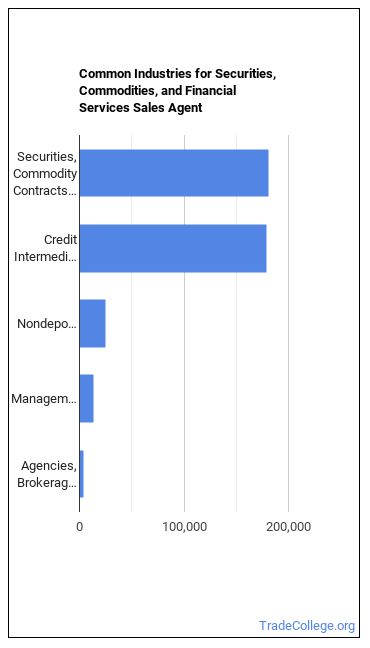
Securities, Commodities, and Financial Services Sales Agents Sector

Below are examples of industries where Securities, Commodities, and Financial Services Sales Agents work:

References:
More about our data sources and methodologies.
