Find Trade Colleges
What You Need to Know About Plumber, Pipefitter, or Steamfitter
Job Description: Assemble, install, alter, and repair pipelines or pipe systems that carry water, steam, air, or other liquids or gases. May install heating and cooling equipment and mechanical control systems. Includes sprinklerfitters.
Featured schools near , edit
Related Job Titles
- Master Plumber
- Marine Steamfitter
- Water Pump Installer
- Industrial Gas Fitter
- Marine Pipefitter
Job Outlook for Plumbers, Pipefitters, and Steamfitters
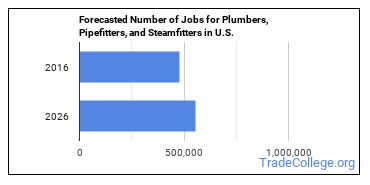
In 2016, there was an estimated number of 480,600 jobs in the United States for Plumber, Pipefitter, or Steamfitter. New jobs are being produced at a rate of 15.6% which is above the national average. The Bureau of Labor Statistics predicts 75,200 new jobs for Plumber, Pipefitter, or Steamfitter by 2026. There will be an estimated 61,000 positions for Plumber, Pipefitter, or Steamfitter per year.

The states with the most job growth for Plumber, Pipefitter, or Steamfitter are Utah, Nevada, and Arizona. Watch out if you plan on working in Maine, Alaska, or Vermont. These states have the worst job growth for this type of profession.
What is the Average Salary of a Plumber, Pipefitter, or Steamfitter
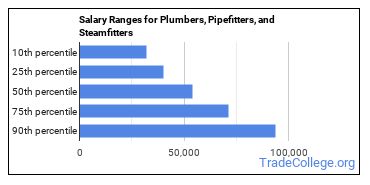
The typical yearly salary for Plumbers, Pipefitters, and Steamfitters is somewhere between $32,100 and $93,700.

Plumbers, Pipefitters, and Steamfitters who work in Illinois, Alaska, or Minnesota, make the highest salaries.
How much do Plumbers, Pipefitters, and Steamfitters make in each U.S. state?
| State | Annual Mean Salary |
|---|---|
| Alabama | $45,260 |
| Alaska | $75,520 |
| Arizona | $48,950 |
| Arkansas | $43,540 |
| California | $61,410 |
| Colorado | $53,350 |
| Connecticut | $63,780 |
| Delaware | $61,640 |
| District of Columbia | $69,800 |
| Florida | $44,200 |
| Georgia | $48,680 |
| Hawaii | $73,810 |
| Idaho | $47,320 |
| Illinois | $79,400 |
| Indiana | $60,030 |
| Iowa | $52,060 |
| Kansas | $55,140 |
| Kentucky | $55,890 |
| Louisiana | $54,940 |
| Maine | $50,830 |
| Maryland | $60,610 |
| Massachusetts | $70,320 |
| Michigan | $61,620 |
| Minnesota | $74,220 |
| Mississippi | $45,280 |
| Missouri | $63,550 |
| Montana | $60,940 |
| Nebraska | $55,110 |
| Nevada | $55,600 |
| New Hampshire | $55,180 |
| New Jersey | $71,370 |
| New Mexico | $45,420 |
| New York | $73,820 |
| North Carolina | $43,750 |
| North Dakota | $53,800 |
| Ohio | $55,640 |
| Oklahoma | $50,710 |
| Oregon | $73,810 |
| Pennsylvania | $60,380 |
| South Carolina | $44,970 |
| South Dakota | $43,600 |
| Tennessee | $48,850 |
| Texas | $49,180 |
| Utah | $51,970 |
| Vermont | $51,210 |
| Virginia | $50,330 |
| Washington | $67,090 |
| West Virginia | $60,000 |
| Wisconsin | $68,510 |
| Wyoming | $53,550 |
Where Plumbers, Pipefitters, and Steamfitters Work

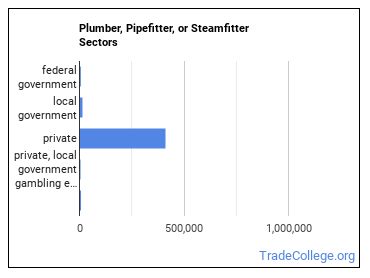
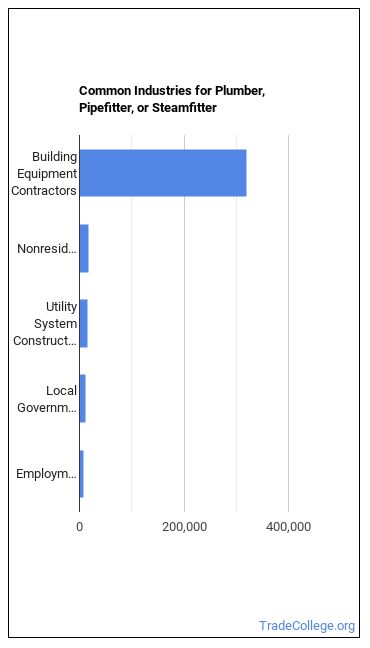
The table below shows the approximate number of Plumbers, Pipefitters, and Steamfitters employed by various industries.

References:
More about our data sources and methodologies.
