Find Trade Colleges
Pile-Driver Operators in Oregon
Get the information you need to know about working as a Pile-Driver Operator.
You’re in luck! Jobs for Pile-Driver Operators in Oregon are projected to grow and these jobs tend to pay higher than average.
-
Projected employment for Pile-Driver Operators in Oregon is growing faster than average.
-
Pile-Driver Operators in Oregon earn higher salaries than the typical U.S. wage earner.
Featured schools near , edit
How Many Pile-Driver Operators Work in Oregon?
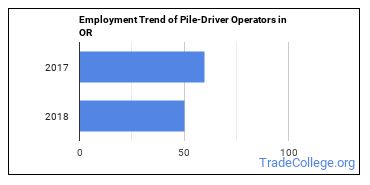
50 people worked as Pile-Driver Operators in 2018 in this state.
There were 60 Pile-Driver Operators employed in this state in 2017.
That’s a decline of 10 jobs between 2017 and 2018.

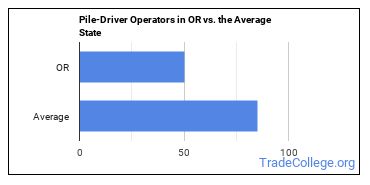
The typical state has 85 Pile-Driver Operators working in it, which means Oregon has fewer Pile-Driver Operators than average.

Job Projections for Oregon
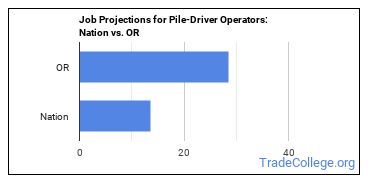
Jobs for Pile-Driver Operators in this state are growing at a rate of 28.6% which is faster than the nationwide estimated projection of 13.5%.

Oregon Annual Job Openings
The BLS estimates 10 annual job openings, and a total of 90 jobs for Oregon Pile-Driver Operators in 2026.
Nationwide, the prediction is 500 annual jobs and 4,200 total jobs in 2026.
What do Pile-Driver Operators Make in Oregon?
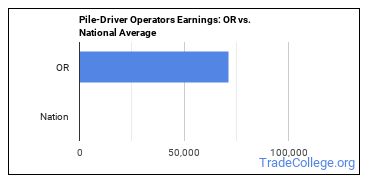
In 2018 wages for Pile-Driver Operators ranged from $55,440 to $94,900 with $71,210 being the median annual salary.
Broken down to an hourly rate, workers in this field made anywhere from $26.65 to $45.62. The median hourly rate was $34.24.
Workers in this field were paid a median of $27.01 an hour in 2017.
The hourly rate grew by $7.23.
The median salary in Oregon is higher than the nationwide median salary.

Top Oregon Metros for Pile-Driver Operators
The table below shows some of the metros in this state with the most Pile-Driver Operators.
| Metro | Number Employed | Annual Median Salary |
|---|---|---|
| Portland-Vancouver-Hillsboro, OR-WA | 60 | $74,410 |
Top States for Pile-Driver Operators Employment
View the list below to see where most Pile-Driver Operators work.
| State | Number Employed | Annual Median Salary |
|---|---|---|
| California | 460 | $86,710 |
| Texas | 400 | $55,260 |
| Florida | 330 | $49,160 |
| Louisiana | 310 | $47,890 |
| Massachusetts | 210 | $89,060 |
| South Carolina | 190 | $35,940 |
| Washington | 190 | $78,990 |
| Virginia | 120 | $48,240 |
| North Carolina | 110 | $37,360 |
| New Jersey | 90 | $0 |
| New York | 80 | $0 |
| Pennsylvania | 80 | $75,170 |
| Maryland | 70 | $50,670 |
| Michigan | 70 | $73,520 |
| Georgia | 60 | $45,700 |
| Minnesota | 60 | $71,470 |
| Oregon | 50 | $71,210 |
| Rhode Island | 50 | $59,740 |
| Delaware | 40 | $0 |
| Indiana | 40 | $0 |
Below are the states where Pile-Driver Operators get paid the most:
| State | Annual Median Salary |
|---|---|
| Illinois | $90,820 |
| Massachusetts | $89,060 |
| California | $86,710 |
| Washington | $78,990 |
| Pennsylvania | $75,170 |
| Michigan | $73,520 |
| Minnesota | $71,470 |
| Oregon | $71,210 |
| Rhode Island | $59,740 |
| Texas | $55,260 |
Related Careers in OR
You may also be interested in the following careers:
| Occupation | OR Employment Total |
|---|
References
- Bureau of Labor Statistics (BLS)
- College Factual
- National Center for Education Statistics
- O*NET Online
More about our data sources and methodologies.
