Find Trade Colleges
Machinists in Oregon
Get the information you need to know about working as a Machinist.
You’re in luck! Jobs for Machinists in Oregon are projected to grow and these jobs tend to pay higher than average.
-
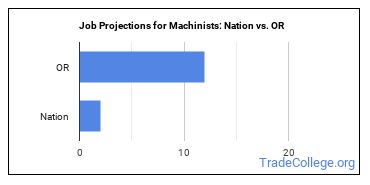
Projected employment for Machinists in Oregon is growing faster than average.
-
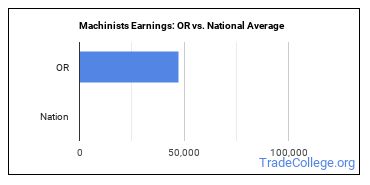
Machinists in Oregon earn lower salaries than the typical U.S. wage earner.
What Major Will Prepare You For a Machinist Career?
- Precision Production
- Precision Metal Working
- Machine Tool Technology/Machinist
- Machine Shop Technology/Assistant
How Many Machinists Work in Oregon?
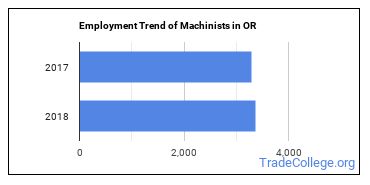
In 2018, there were 3,360 Machinists working in the state.
There were 3,300 Machinists employed in this state in 2017.
That’s growth of 60 jobs between 2017 and 2018.

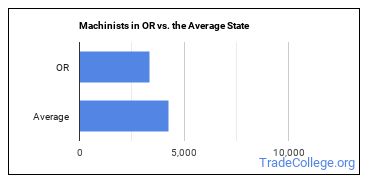
The typical state has 4,240 Machinists working in it, which means Oregon has fewer Machinists than average.

Job Projections for Oregon
Jobs for Machinists in this state are growing at a rate of 12.0% which is faster than the nationwide estimated projection of 2.0%.

Oregon Annual Job Openings
The BLS estimates 430 annual job openings, and a total of 4,100 jobs for Oregon Machinists in 2026.
Nationwide, the prediction is 40,700 annual jobs and 404,100 total jobs in 2026.
What do Machinists Make in Oregon?
In 2018 wages for Machinists ranged from $29,240 to $71,570 with $47,410 being the median annual salary.
Broken down to an hourly rate, workers in this field made anywhere from $14.06 to $34.41. The median hourly rate was $22.79.
Workers in this field were paid a median of $22.61 an hour in 2017.
The hourly rate grew by $0.18.
The median salary in Oregon is higher than the nationwide median salary.

Explore Best Ranked Schools for You
Top Oregon Metros for Machinists
The table below shows some of the metros in this state with the most Machinists.
| Metro | Number Employed | Annual Median Salary |
|---|---|---|
| Portland-Vancouver-Hillsboro, OR-WA | 2,470 | $48,830 |
| Eugene, OR | 390 | $43,420 |
| Albany, OR | 150 | $54,410 |
| Medford, OR | 140 | $44,150 |
| Salem, OR | 140 | $42,340 |
| Bend-Redmond, OR | 70 | $45,340 |
| Corvallis, OR | 60 | $37,570 |
| Grants Pass, OR | 40 | $35,620 |
Top States for Machinists Employment
View the list below to see where most Machinists work.
| State | Number Employed | Annual Median Salary |
|---|---|---|
| California | 36,530 | $45,080 |
| Illinois | 31,000 | $38,540 |
| Michigan | 27,020 | $39,920 |
| Ohio | 26,250 | $41,390 |
| Texas | 26,050 | $45,570 |
| Indiana | 18,390 | $42,880 |
| Pennsylvania | 17,060 | $43,730 |
| New York | 14,000 | $45,550 |
| Minnesota | 12,870 | $49,510 |
| Wisconsin | 12,820 | $42,070 |
| South Carolina | 12,480 | $36,270 |
| North Carolina | 11,710 | $40,890 |
| Washington | 10,300 | $50,110 |
| Florida | 9,250 | $40,780 |
| Massachusetts | 7,790 | $51,050 |
| Tennessee | 7,690 | $43,110 |
| Connecticut | 7,590 | $49,950 |
| Georgia | 7,240 | $40,330 |
| Missouri | 6,280 | $43,470 |
| Kentucky | 6,240 | $42,430 |
Below are the states where Machinists get paid the most:
| State | Annual Median Salary |
|---|---|
| Alaska | $68,080 |
| Hawaii | $67,810 |
| District of Columbia | $58,280 |
| Delaware | $56,310 |
| Maryland | $53,480 |
| North Dakota | $52,360 |
| Wyoming | $52,300 |
| New Mexico | $51,670 |
| Massachusetts | $51,050 |
| Washington | $50,110 |
References
- Bureau of Labor Statistics (BLS)
- College Factual
- National Center for Education Statistics
- O*NET Online
More about our data sources and methodologies.
