Installation, Maintenance, and Repair Workers in District of Columbia
Considering a career as an Installation, Maintenance, and Repair Worker in District of Columbia?
- Installation, Maintenance, and Repair Workers in District of Columbia earn higher salaries than the typical U.S. wage earner.
Featured schools near , edit
How Many Installation, Maintenance, and Repair Workers Work in District of Columbia?
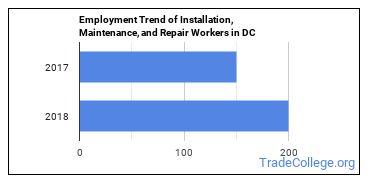
In 2018, there were 200 Installation, Maintenance, and Repair Workers working in the state.
There were 150 Installation, Maintenance, and Repair Workers employed in this state in 2017.
That’s growth of 50 jobs between 2017 and 2018.

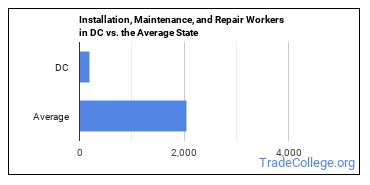
The typical state has 2,040 Installation, Maintenance, and Repair Workers working in it, which means District of Columbia has fewer Installation, Maintenance, and Repair Workers than average.

What do Installation, Maintenance, and Repair Workers Make in District of Columbia?
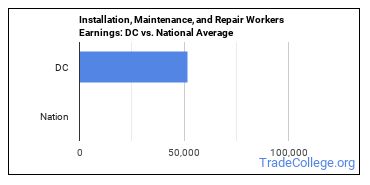
In 2018 wages for Installation, Maintenance, and Repair Workers ranged from $34,180 to $84,550 with $51,770 being the median annual salary.
Broken down to an hourly rate, workers in this field made anywhere from $16.43 to $40.65. The median hourly rate was $24.89.
Workers in this field were paid a median of $27.68 an hour in 2017.
The hourly rate declined by $2.79.
The median salary in District of Columbia is higher than the nationwide median salary.

Top District of Columbia Metros for Installation, Maintenance, and Repair Workers
The table below shows some of the metros in this state with the most Installation, Maintenance, and Repair Workers.
| Metro | Number Employed | Annual Median Salary |
|---|---|---|
| Washington-Arlington-Alexandria, DC-VA-MD-WV | 3,290 | $46,100 |
Top States for Installation, Maintenance, and Repair Workers Employment
The table below shows the states where most Installation, Maintenance, and Repair Workers work.
| State | Number Employed | Annual Median Salary |
|---|---|---|
| California | 21,190 | $41,080 |
| Florida | 15,100 | $34,220 |
| Texas | 10,370 | $37,920 |
| Illinois | 9,360 | $45,090 |
| New York | 6,860 | $36,470 |
| Tennessee | 5,910 | $35,590 |
| Ohio | 5,590 | $38,430 |
| Maryland | 5,420 | $41,520 |
| Louisiana | 4,740 | $41,650 |
| New Jersey | 4,540 | $37,740 |
| Georgia | 4,530 | $37,190 |
| Arizona | 3,990 | $38,860 |
| North Carolina | 3,850 | $37,030 |
| Colorado | 3,750 | $37,870 |
| Virginia | 3,480 | $43,160 |
| Pennsylvania | 3,210 | $44,310 |
| Washington | 2,960 | $53,740 |
| Oregon | 2,680 | $40,080 |
| Nevada | 2,670 | $47,560 |
| Minnesota | 2,640 | $43,990 |
Below are the states where Installation, Maintenance, and Repair Workers get paid the most:
| State | Annual Median Salary |
|---|---|
| Alaska | $66,580 |
| Hawaii | $64,120 |
| Washington | $53,740 |
| District of Columbia | $51,770 |
| North Dakota | $48,960 |
| New Hampshire | $47,680 |
| Nevada | $47,560 |
| Massachusetts | $47,470 |
| Nebraska | $47,030 |
| Mississippi | $45,480 |
Related Careers in DC
You may also be interested in the following careers:
| Occupation | DC Employment Total |
|---|
References
- Bureau of Labor Statistics (BLS)
- College Factual
- National Center for Education Statistics
- O*NET Online
More about our data sources and methodologies.
Featured Schools
 Request Info
|
Southern New Hampshire University You have goals. Southern New Hampshire University can help you get there. Whether you need a bachelor's degree to get into a career or want a master's degree to move up in your current career, SNHU has an online program for you. Find your degree from over 200 online programs. Learn More > |
