Find Trade Colleges
Gambling Service Workers, All Other: Job Description
All gambling service workers not listed separately.
What Do Gambling Service Workers, All Other Do?
Types of Gambling Service Workers, All Other Jobs
Common job titles for this role include:
- Bingo Attendant
- Bingo Caller
- Bingo Checker
- Bingo Clerk
- Bingo Usher
- Card Player
- Card Seller
- Card Table Attendant
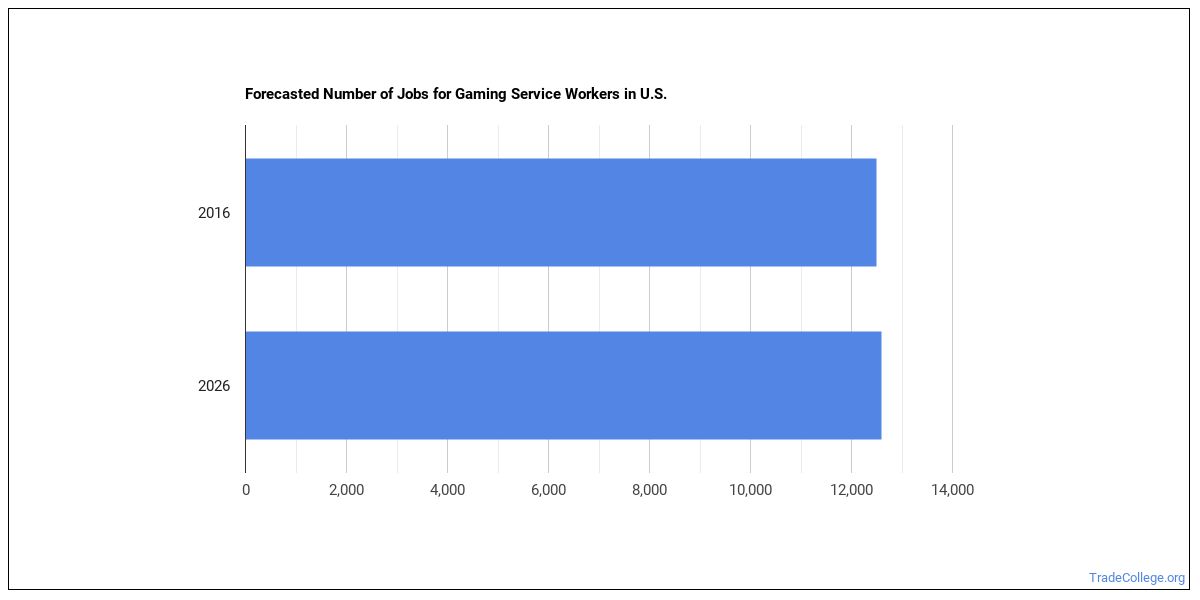
How Many Gambling Service Workers, All Other Are There?
There are about 408,528 gambling service workers, all other working in the United States today. This occupation is expected to decline by -0.7% over the projection horizon.
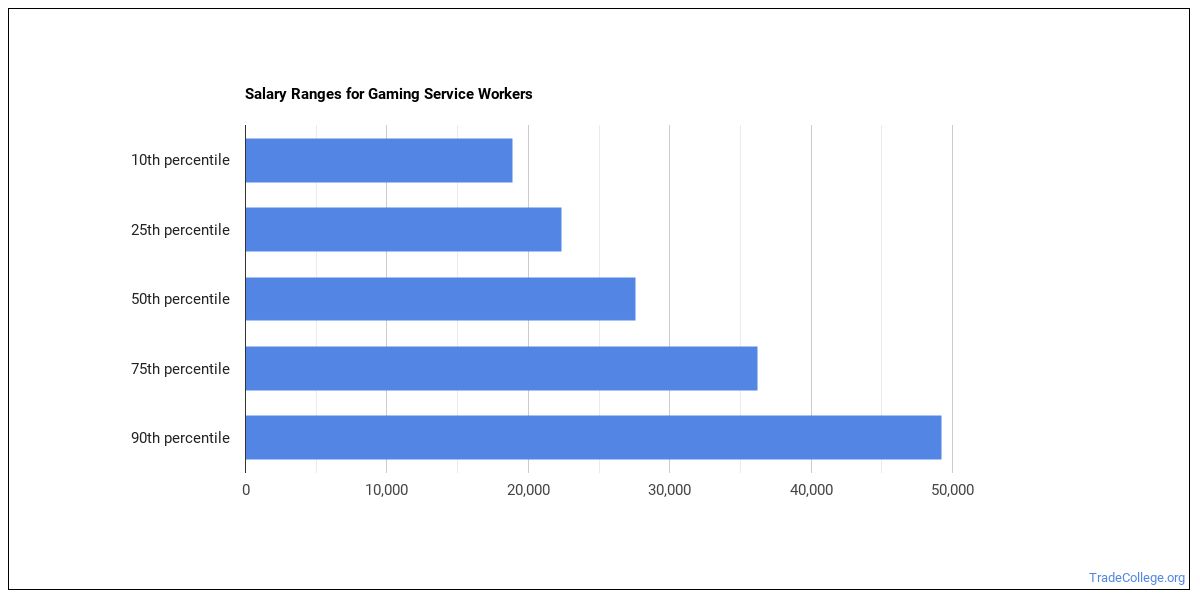
Salary for Gambling Service Workers, All Other
| Statistic | Value |
|---|---|
| Annual median | $57,834 |
| Hourly median | $27.80 |
| 10th percentile | $33,826 |
| 25th percentile | $45,830 |
| 75th percentile | $69,838 |
| 90th percentile | $81,842 |
Wages vary widely based on experience, location, and industry.
Gambling Service Workers, All Other Salary by State
| State | Annual median salary |
|---|---|
| Illinois | $46,840 |
| Iowa | $46,840 |
| Colorado | $45,410 |
| Florida | $38,760 |
| Massachusetts | $38,730 |
| Arizona | $37,990 |
| Washington | $37,970 |
| California | $37,260 |
| Connecticut | $36,840 |
| Alaska | $36,650 |
| Nevada | $36,510 |
| Michigan | $35,930 |
| North Dakota | $33,820 |
| Mississippi | $32,660 |
| Oregon | $32,450 |
| Maryland | $32,140 |
| Ohio | $31,230 |
| New Mexico | $31,170 |
| South Dakota | $29,520 |
| Minnesota | $29,450 |
| Pennsylvania | $28,180 |
| Louisiana | $28,180 |
| Missouri | $28,080 |
| Texas | $27,000 |
| Oklahoma | $25,120 |
| Montana | $23,430 |
| West Virginia | $18,700 |
Pay by U.S. Region
Pay for gambling service workers, all other vary by region. The following regions pay the most:
| Region | Median annual wage | Share of U.S. jobs | Location quotient |
|---|---|---|---|
| Great Lakes | $39,298 | 6.0% | 0.61 |
| New England | $36,922 | 4.9% | 3.87 |
| Far Western US | $36,919 | 36.1% | 10.44 |
| Southeast | $31,661 | 13.2% | 2.65 |
| Plains States | $29,660 | 21.9% | 9.49 |
| Middle Atlantic | $29,240 | 4.0% | 0.67 |
| Southwest | $27,861 | 9.9% | 0.80 |
| Rocky Mountains | $26,227 | 3.9% | 8.45 |
Highest-Paying Metro Areas for Gambling Service Workers, All Other
| Metro area | State | Median annual wage | Employment |
|---|---|---|---|
| Baltimore-Columbia-Towson, MD | MD | $46,340 | 70 |
| Seattle-Tacoma-Bellevue, WA | WA | $42,280 | 170 |
| San Francisco-Oakland-Fremont, CA | CA | $40,060 | 70 |
| Sacramento-Roseville-Folsom, CA | CA | $38,480 | 210 |
| San Diego-Chula Vista-Carlsbad, CA | CA | $38,440 | 260 |
| Riverside-San Bernardino-Ontario, CA | CA | $37,260 | 290 |
| Las Vegas-Henderson-North Las Vegas, NV | NV | $37,240 | 1,530 |
| Reno, NV | NV | $36,300 | 200 |
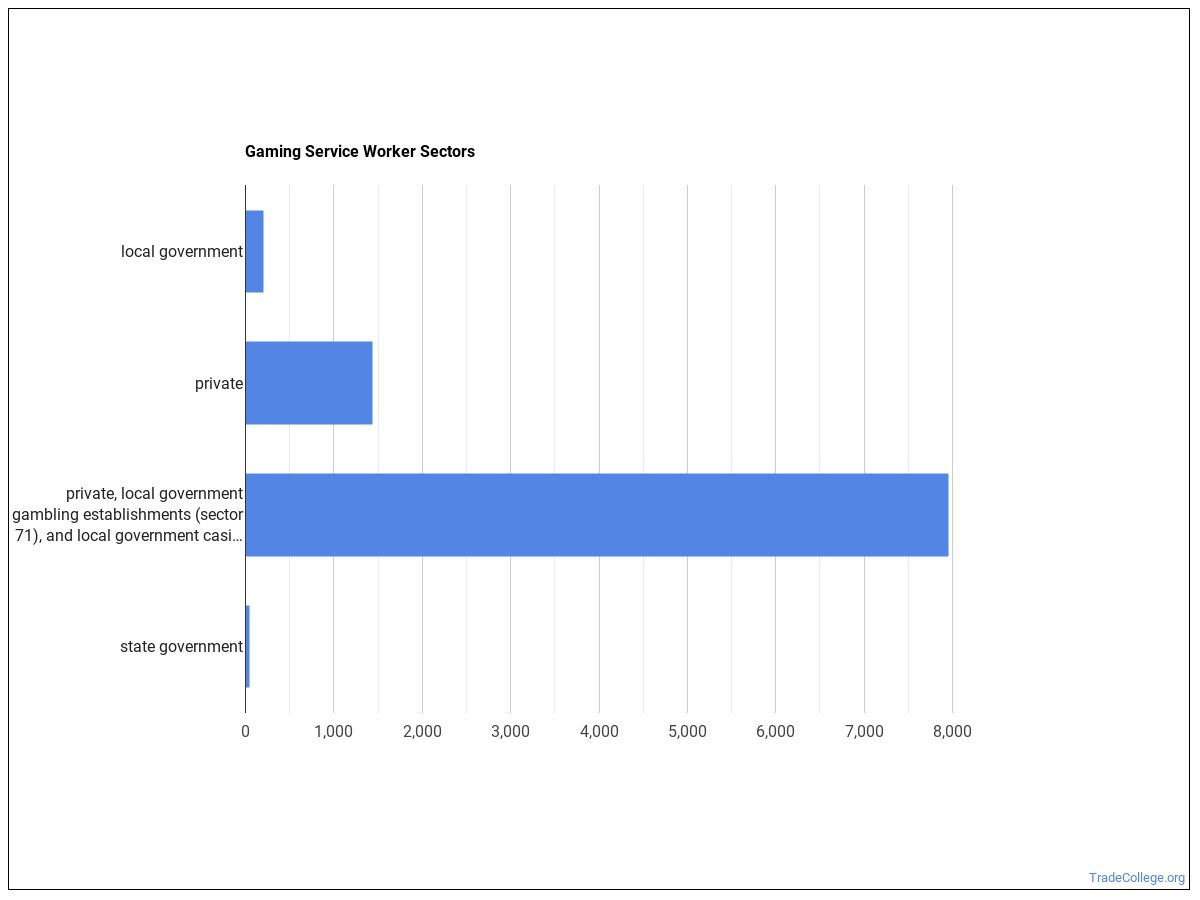
Which Industries Hire Gambling Service Workers, All Other
The largest employers of gambling service workers, all other are concentrated in the following sectors:
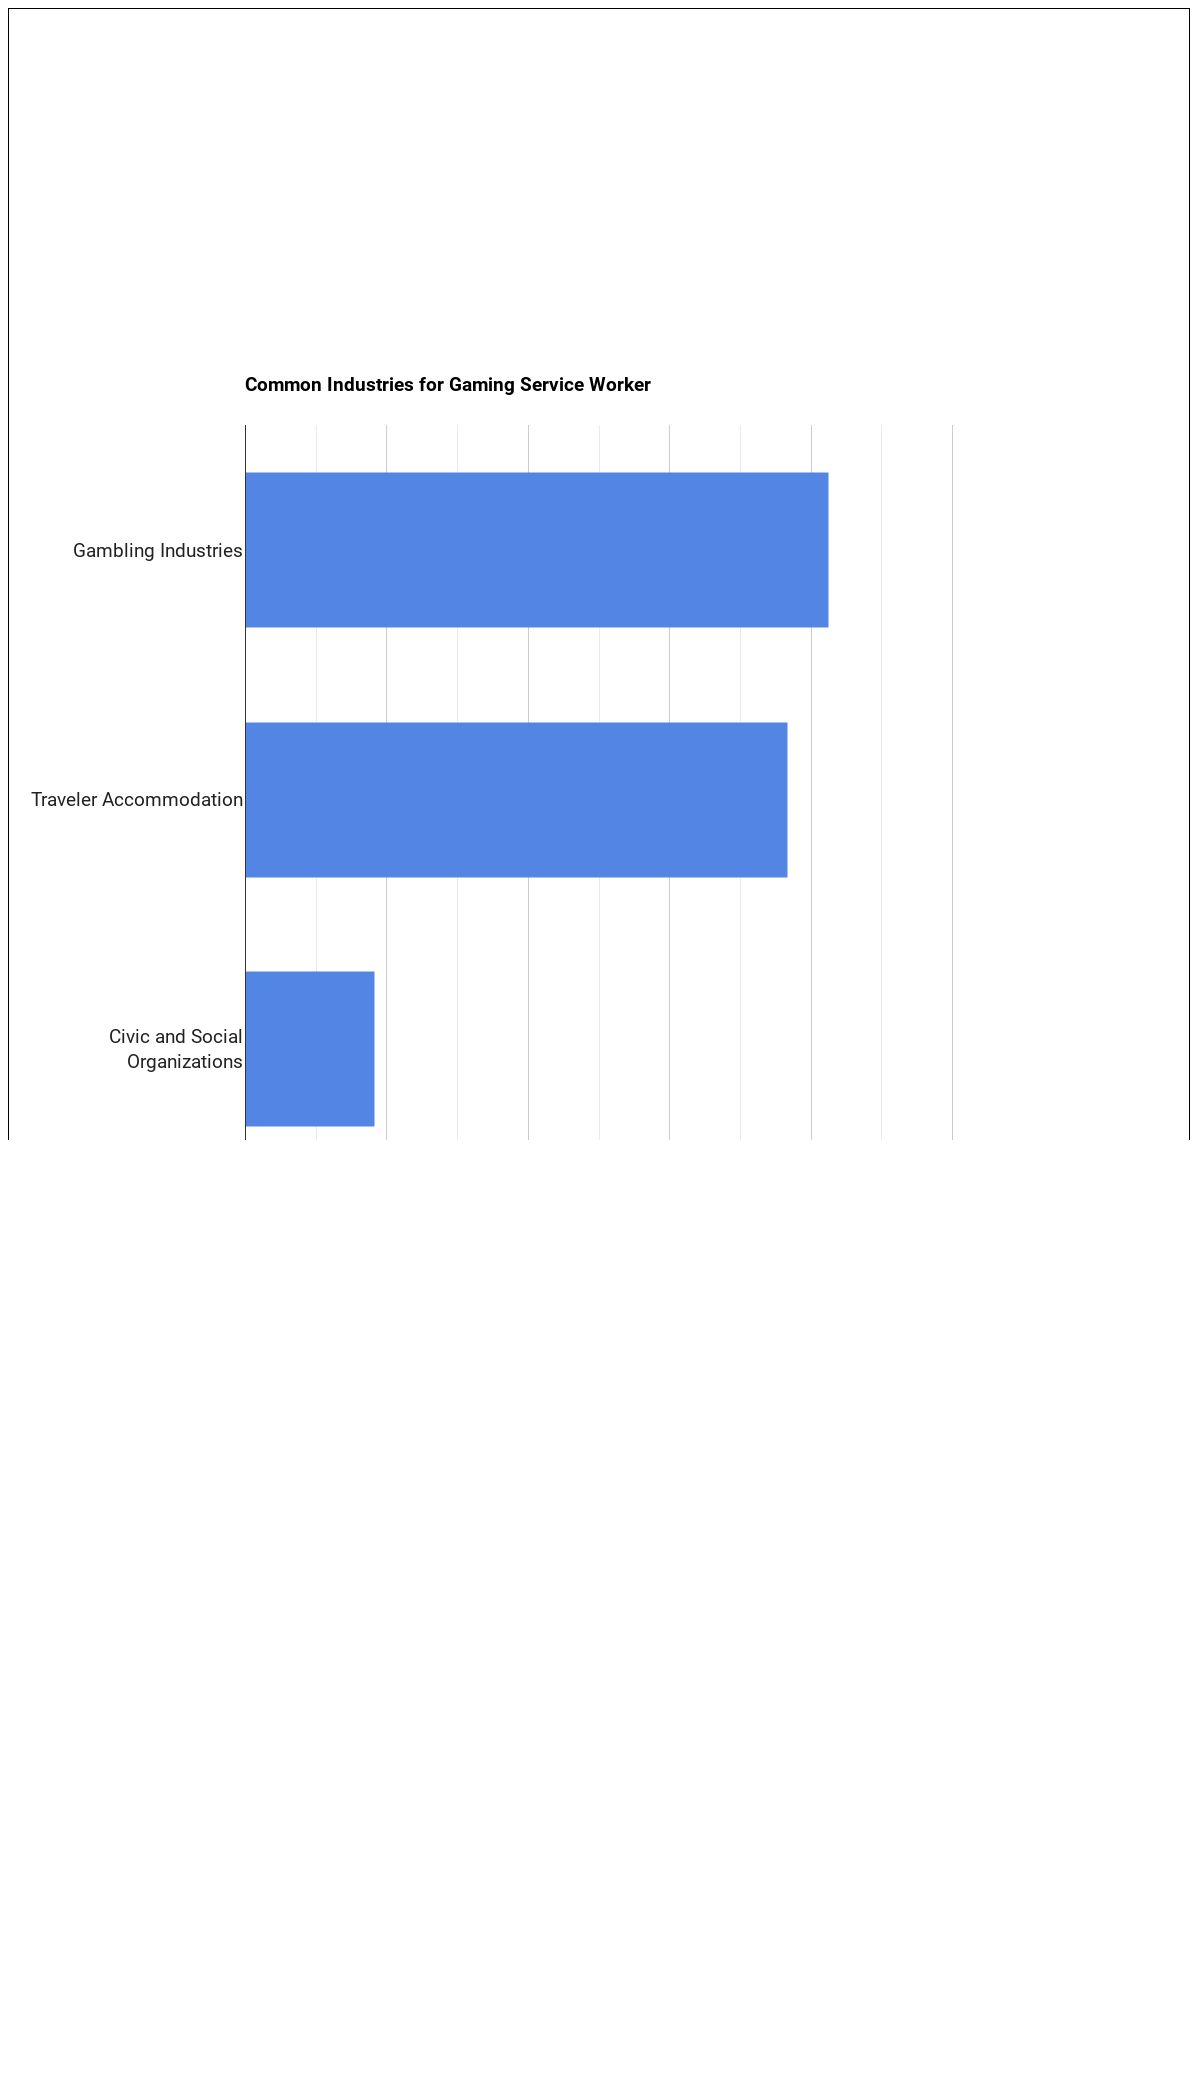
| Industry | Employment | Median annual wage |
|---|---|---|
| Arts, Entertainment, and Recreation | 6,750 | $33,280 |
| Accommodation and Food Services | 4,050 | $36,400 |
| Other Services (except Public Administration) | 2,630 | $28,930 |
The table below shows some of the most common industries where those employed in this career field work.
About the Data
Statistics shown above are sourced from the following authoritative sources:
- U.S. Bureau of Labor Statistics — Occupational Employment and Wage Statistics (OEWS) for employment and wage data by state and industry.
- BLS Employment Projections for total employment and growth forecasts.
- O*NET (Occupational Information Network) for skills, knowledge, tasks, work activities, work context, technology, and education-zone data.
SOC code: 39-3019.00 (Gambling Service Workers, All Other).
TradeCollege.org provides higher-education, college and university, degree, program, career, salary, and other helpful information to students, faculty, institutions, and other internet audiences. Presented information and data are subject to change. Inclusion on this website does not imply or represent a direct relationship with the company, school, or brand. Information, though believed correct at time of publication, may not be correct, and no warranty is provided. Contact the schools to verify any information before relying on it. Financial aid may be available for those who qualify. TradeCollege.org is a for-profit site, and the displayed options may include sponsored or recommended results, not necessarily based on your preferences.
© TradeCollege.org – All Rights Reserved.