Find Trade Colleges
Food Preparation and Serving Related Workers, All Other: Career Profile
All food preparation and serving related workers not listed separately.
What Do Food Preparation and Serving Related Workers, All Other Perform?
Other Food Preparation and Serving Related Workers, All Other Job Titles
Common job titles for this role include:
- Automat Car Attendant
- Dietitian Helper
- Food Aide
- Food Mobile Driver
- Food Order Expediter
- Food and Beverage Checker
- Galley Boy
- Galley Worker
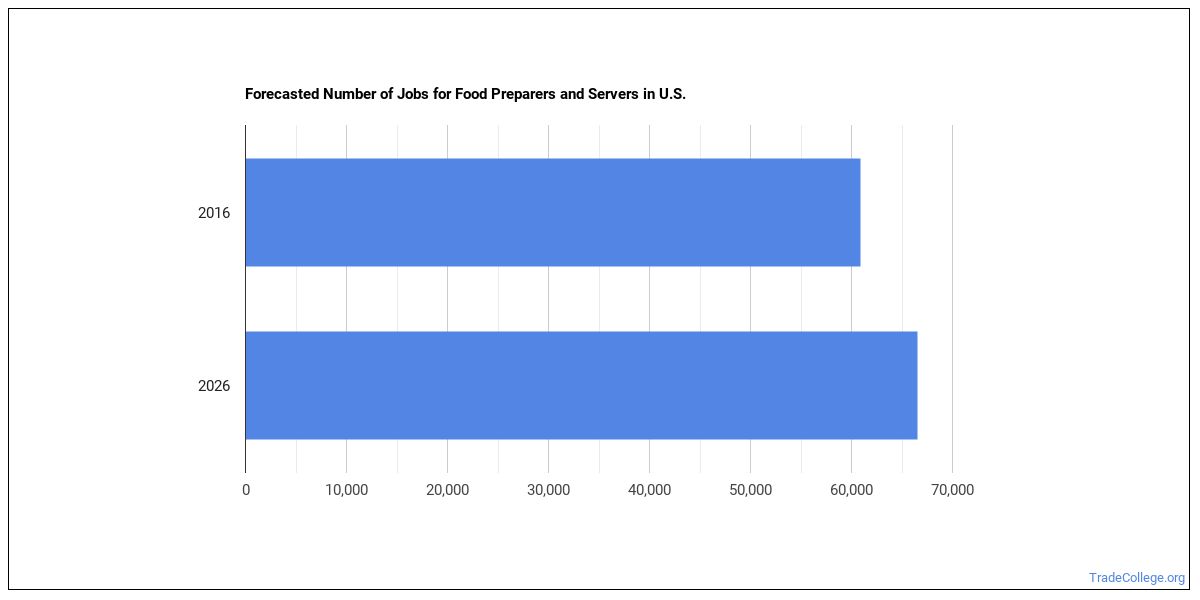
Job Outlook
The U.S. employs around 599,792 food preparation and serving related workers, all other working in the United States today. This occupation is expected to grow by +6.7% over the projection horizon.
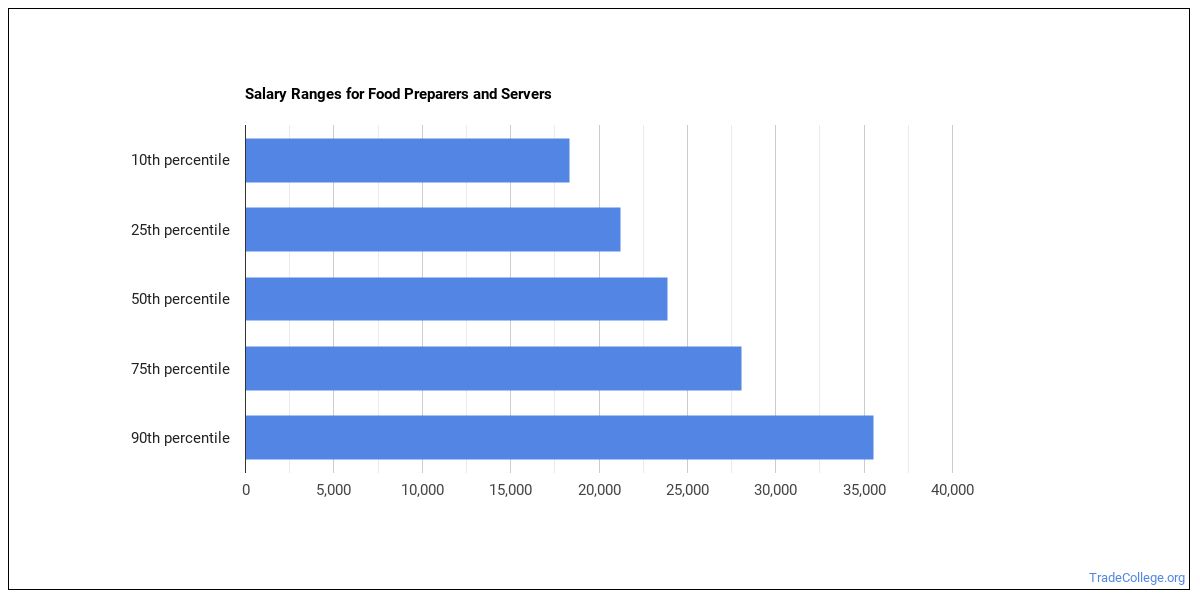
Food Preparation and Serving Related Workers, All Other Pay
| Statistic | Value |
|---|---|
| Annual median | $30,511 |
| Hourly median | $14.67 |
| 10th percentile | $20,000 |
| 25th percentile | $24,410 |
| 75th percentile | $36,611 |
| 90th percentile | $42,712 |
Compensation varies based on experience, location, and industry.
Food Preparation and Serving Related Workers, All Other Salary by State
| State | Annual median salary |
|---|---|
| Hawaii | $62,110 |
| Virgin Islands | $43,410 |
| Colorado | $37,860 |
| Arizona | $37,040 |
| Indiana | $36,930 |
| Illinois | $36,590 |
| Oregon | $36,580 |
| Maryland | $36,480 |
| California | $36,220 |
| New Hampshire | $36,120 |
| Nevada | $35,670 |
| New Mexico | $35,540 |
| Wyoming | $35,130 |
| New Jersey | $35,110 |
| Wisconsin | $34,850 |
| Michigan | $34,320 |
| Florida | $33,960 |
| Washington | $33,930 |
| Nebraska | $33,820 |
| Connecticut | $33,710 |
| Iowa | $33,390 |
| New York | $33,350 |
| Utah | $32,940 |
| Massachusetts | $32,680 |
| Pennsylvania | $32,310 |
| Maine | $31,200 |
| Vermont | $30,960 |
| Kentucky | $30,440 |
| Virginia | $29,950 |
| Arkansas | $29,510 |
| Tennessee | $29,210 |
| Texas | $28,100 |
| Ohio | $27,600 |
| Delaware | $27,560 |
| Georgia | $27,390 |
| Montana | $27,330 |
| North Carolina | $27,320 |
| Mississippi | $25,810 |
| Missouri | $25,580 |
| Alabama | $22,730 |
| West Virginia | $22,610 |
| South Carolina | $22,020 |
| Guam | $21,960 |
| Puerto Rico | $21,780 |
| Louisiana | $21,550 |
| North Dakota | $21,300 |
Pay by U.S. Region
Earnings for food preparation and serving related workers, all other vary by region. These regions lead on median pay:
| Region | Median annual wage | Share of U.S. jobs | Location quotient |
|---|---|---|---|
| Far Western US | $36,199 | 40.4% | 2.95 |
| Rocky Mountains | $36,130 | 3.2% | 1.14 |
| Middle Atlantic | $35,249 | 12.8% | 1.85 |
| New England | $33,712 | 2.0% | 1.08 |
| Plains States | $33,543 | 0.7% | 0.38 |
| Great Lakes | $33,001 | 10.9% | 0.99 |
| Southwest | $30,032 | 6.8% | 0.54 |
| Southeast | $28,041 | 22.7% | 1.79 |
Top Metro Areas
| Metro area | State | Median annual wage | Employment |
|---|---|---|---|
| Kahului-Wailuku, HI | HI | $58,030 | 40 |
| Boulder, CO | CO | $43,040 | 160 |
| San Jose-Sunnyvale-Santa Clara, CA | CA | $43,000 | 1,790 |
| Trenton-Princeton, NJ | NJ | $42,230 | 370 |
| Austin-Round Rock-San Marcos, TX | TX | $39,930 | 260 |
| Atlantic City-Hammonton, NJ | NJ | $39,880 | 520 |
| Omaha, NE-IA | NE | $39,730 | 100 |
| San Francisco-Oakland-Fremont, CA | CA | $38,960 | 3,670 |
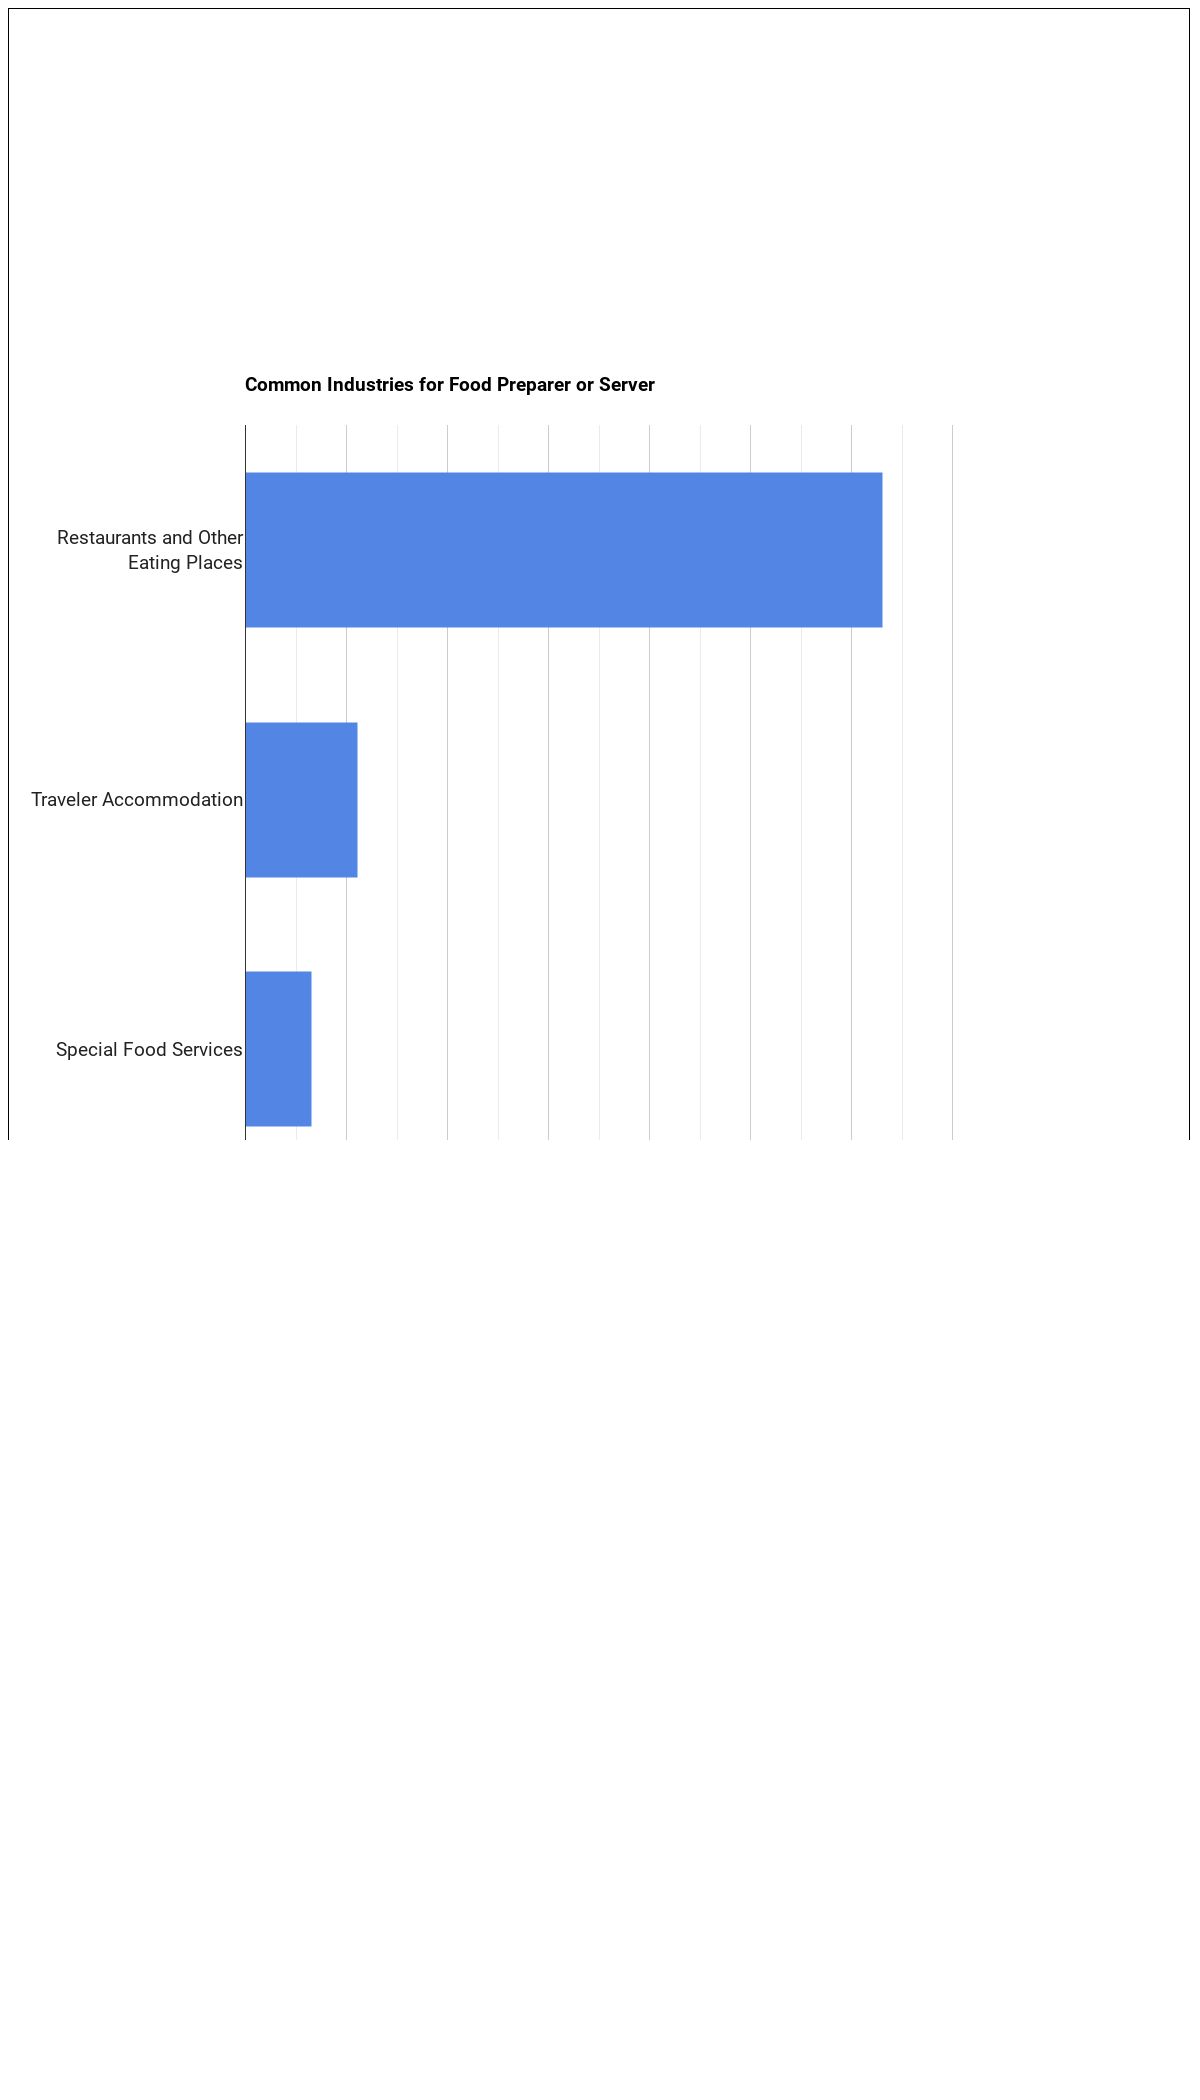
Which Industries Hire Food Preparation and Serving Related Workers, All Other
Most food preparation and serving related workers, all other are found across these industries:
| Industry | Employment | Median annual wage |
|---|---|---|
| Accommodation and Food Services | 72,730 | $34,740 |
| Health Care and Social Assistance | 4,260 | $36,920 |
| Arts, Entertainment, and Recreation | 3,130 | $35,130 |
| Educational Services | 2,760 | $34,230 |
| Administrative and Support and Waste Management and Remediation Services | 2,410 | $34,910 |
| Retail Trade | 1,060 | $31,470 |
| Manufacturing | 500 | $34,990 |
| Other Services (except Public Administration) | 430 | $33,070 |
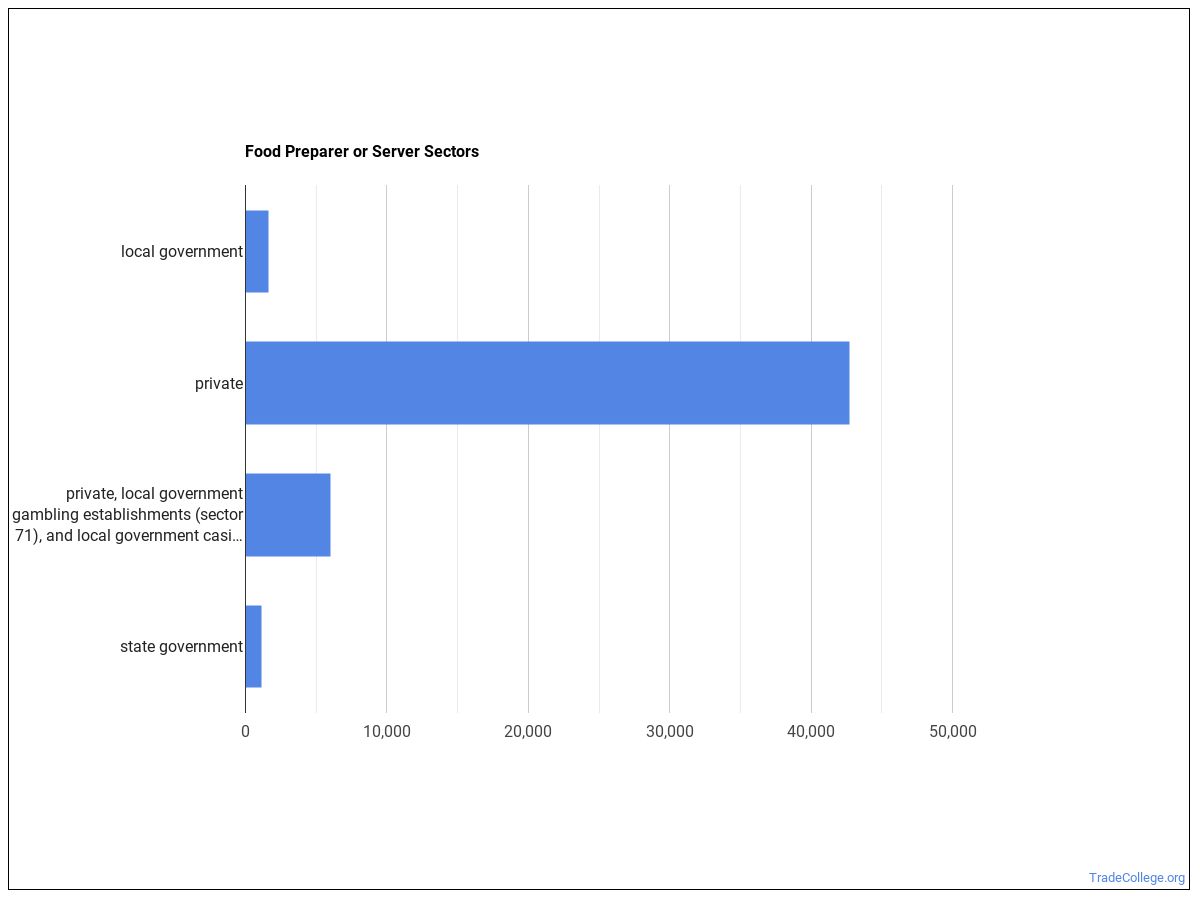
Food Preparation and Serving Related Workers, All Other work in the following industries:
Sources
This profile draws on the following authoritative sources:
- U.S. Bureau of Labor Statistics — Occupational Employment and Wage Statistics (OEWS) for employment and wage data by state and industry.
- BLS Employment Projections for total employment and growth forecasts.
- O*NET (Occupational Information Network) for skills, knowledge, tasks, work activities, work context, technology, and education-zone data.
SOC code: 35-9099.00 (Food Preparation and Serving Related Workers, All Other).
TradeCollege.org provides higher-education, college and university, degree, program, career, salary, and other helpful information to students, faculty, institutions, and other internet audiences. Presented information and data are subject to change. Inclusion on this website does not imply or represent a direct relationship with the company, school, or brand. Information, though believed correct at time of publication, may not be correct, and no warranty is provided. Contact the schools to verify any information before relying on it. Financial aid may be available for those who qualify. TradeCollege.org is a for-profit site, and the displayed options may include sponsored or recommended results, not necessarily based on your preferences.
© TradeCollege.org – All Rights Reserved.