Driver/Sales Workers in Oregon
Considering a career as a Driver/Sales Worker in Oregon?
You’re in luck! Jobs for Driver/Sales Workers in Oregon are projected to grow and these jobs tend to pay higher than average.
-
Projected employment for Driver/Sales Workers in Oregon is growing faster than average.
-
Driver/Sales Workers in Oregon earn lower salaries than the typical U.S. wage earner.
Featured schools near , edit
How Many Driver/Sales Workers Work in Oregon?
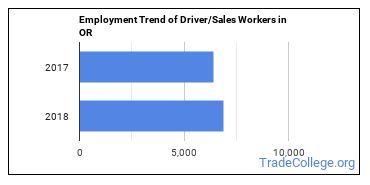
There were approximately 6,910 workers employed as Driver/Sales Workers in this state in 2018.
There were 6,430 Driver/Sales Workers employed in this state in 2017.
That’s growth of 480 jobs between 2017 and 2018.

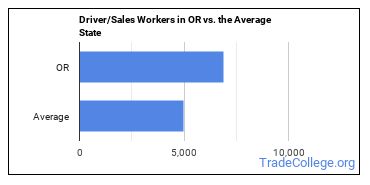
The typical state has 4,980 Driver/Sales Workers working in it, which means Oregon has more Driver/Sales Workers than average.

Job Projections for Oregon
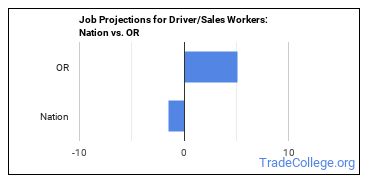
Jobs for Driver/Sales Workers in this state are growing at a rate of 5.1% which is faster than the nationwide estimated projection of -1.5%.

Oregon Annual Job Openings
The BLS estimates 800 annual job openings, and a total of 7,390 jobs for Oregon Driver/Sales Workers in 2026.
Nationwide, the prediction is 48,200 annual jobs and 461,000 total jobs in 2026.
What do Driver/Sales Workers Make in Oregon?
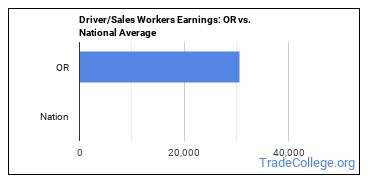
In 2018 wages for Driver/Sales Workers ranged from $22,270 to $52,480 with $30,580 being the median annual salary.
Broken down to an hourly rate, workers in this field made anywhere from $10.71 to $25.23. The median hourly rate was $14.7.
Workers in this field were paid a median of $14.09 an hour in 2017.
The hourly rate grew by $0.61.
The median salary in Oregon is higher than the nationwide median salary.

Top Oregon Metros for Driver/Sales Workers
The table below shows some of the metros in this state with the most Driver/Sales Workers.
| Metro | Number Employed | Annual Median Salary |
|---|---|---|
| Portland-Vancouver-Hillsboro, OR-WA | 4,340 | $31,200 |
| Eugene, OR | 960 | $26,990 |
| Bend-Redmond, OR | 570 | $26,990 |
| Salem, OR | 490 | $27,600 |
| Medford, OR | 310 | $41,120 |
| Grants Pass, OR | 160 | $23,680 |
Top States for Driver/Sales Workers Employment
The table below shows the states where most Driver/Sales Workers work.
| State | Number Employed | Annual Median Salary |
|---|---|---|
| Texas | 42,440 | $23,940 |
| California | 36,440 | $32,940 |
| Florida | 28,850 | $20,580 |
| Ohio | 21,710 | $19,950 |
| New York | 21,420 | $24,870 |
| North Carolina | 17,360 | $20,060 |
| Pennsylvania | 16,080 | $20,790 |
| Georgia | 13,920 | $20,500 |
| Illinois | 13,320 | $20,530 |
| Michigan | 12,880 | $21,770 |
| Colorado | 10,440 | $23,470 |
| Minnesota | 10,180 | $23,750 |
| Arizona | 10,020 | $27,020 |
| Missouri | 9,250 | $23,500 |
| Virginia | 9,140 | $29,940 |
| Indiana | 9,080 | $19,700 |
| Washington | 8,760 | $26,410 |
| New Jersey | 8,680 | $30,000 |
| Massachusetts | 7,910 | $31,250 |
| Wisconsin | 7,830 | $26,650 |
Below are the states where Driver/Sales Workers get paid the most:
| State | Annual Median Salary |
|---|---|
| California | $32,940 |
| Alabama | $32,330 |
| Vermont | $31,870 |
| Hawaii | $31,320 |
| Massachusetts | $31,250 |
| Montana | $31,050 |
| Oregon | $30,580 |
| Nevada | $30,070 |
| New Jersey | $30,000 |
| Alaska | $29,980 |
Related Careers in OR
Discover similar careers:
| Occupation | OR Employment Total |
|---|
References
- Bureau of Labor Statistics (BLS)
- College Factual
- National Center for Education Statistics
- O*NET Online
More about our data sources and methodologies.
Featured Schools
 Request Info
|
Southern New Hampshire University You have goals. Southern New Hampshire University can help you get there. Whether you need a bachelor's degree to get into a career or want a master's degree to move up in your current career, SNHU has an online program for you. Find your degree from over 200 online programs. Learn More > |
