Find Trade Colleges
Chefs and Head Cooks in Ohio
Is Ohio a good place for you to work as a Chef or Head Cook?
You’re in luck! Jobs for Chefs and Head Cooks in Ohio are projected to grow and these jobs tend to pay higher than average.
-
Projected employment for Chefs and Head Cooks in Ohio is growing faster than average.
-
Chefs and Head Cooks in Ohio earn lower salaries than the typical U.S. wage earner.
Featured schools near , edit
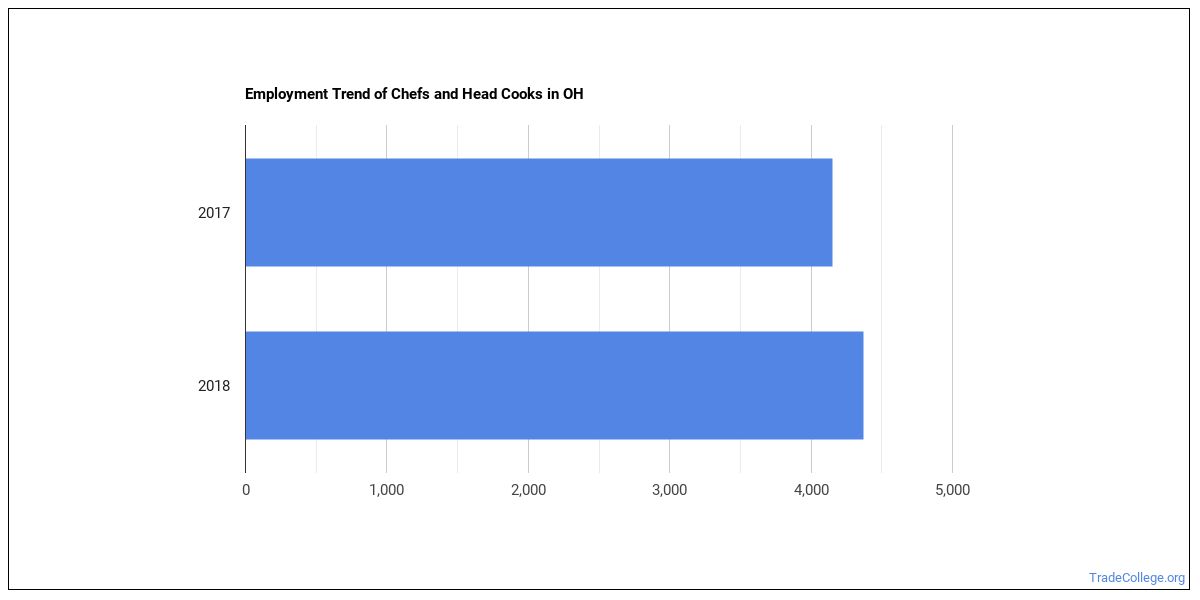
How Many Chefs and Head Cooks Work in Ohio?
In Ohio, there were 4,370 people working as Chefs and Head Cooks in the year 2018.
There were 4,150 Chefs and Head Cooks employed in this state in 2017.
That’s growth of 220 jobs between 2017 and 2018.
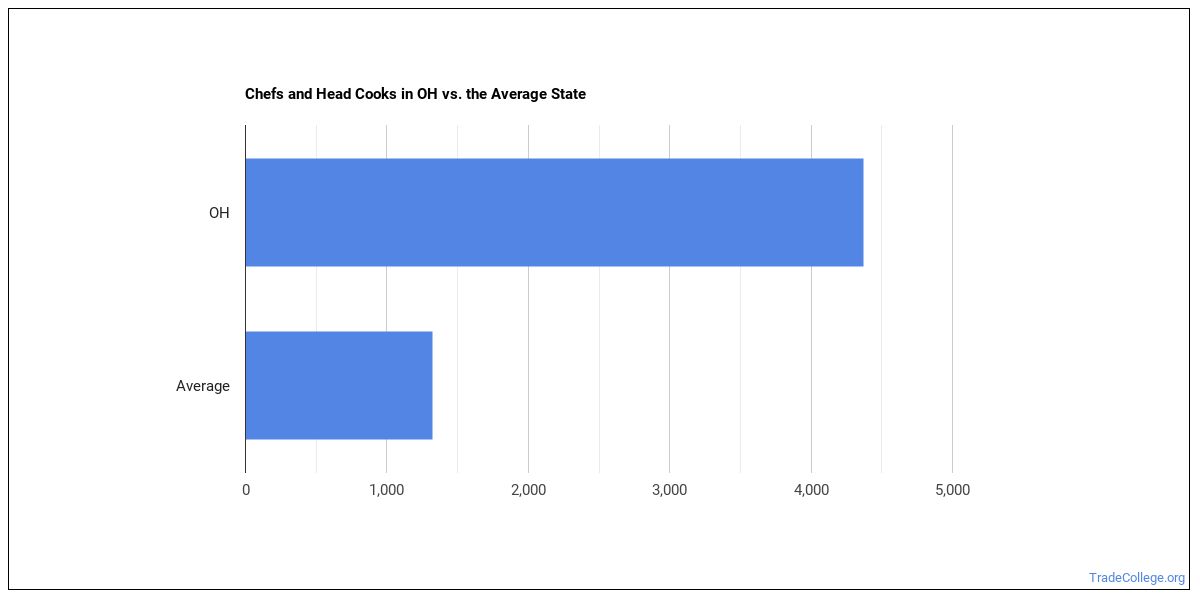
The typical state has 1,325 Chefs and Head Cooks working in it, which means Ohio has more Chefs and Head Cooks than average.
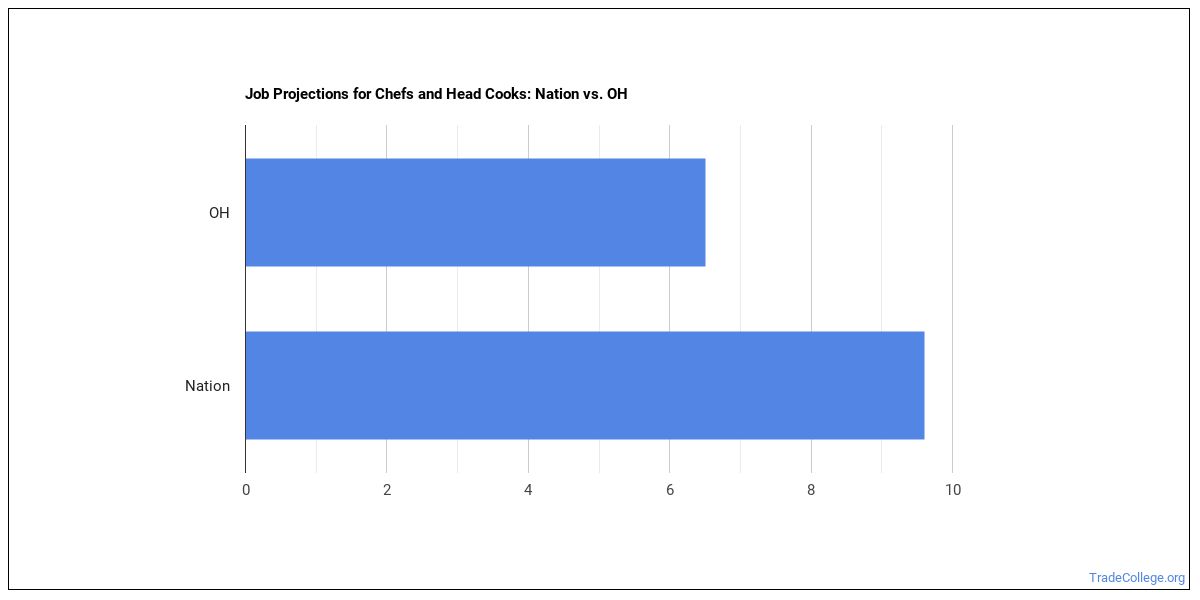
Job Projections for Ohio
Jobs for Chefs and Head Cooks in this state are growing at a rate of 6.5% which is slower than the nationwide estimated projection of 9.6%.
Ohio Annual Job Openings
The BLS estimates 600 annual job openings, and a total of 4,780 jobs for Ohio Chefs and Head Cooks in 2026.
Nationwide, the prediction is 20,300 annual jobs and 160,600 total jobs in 2026.
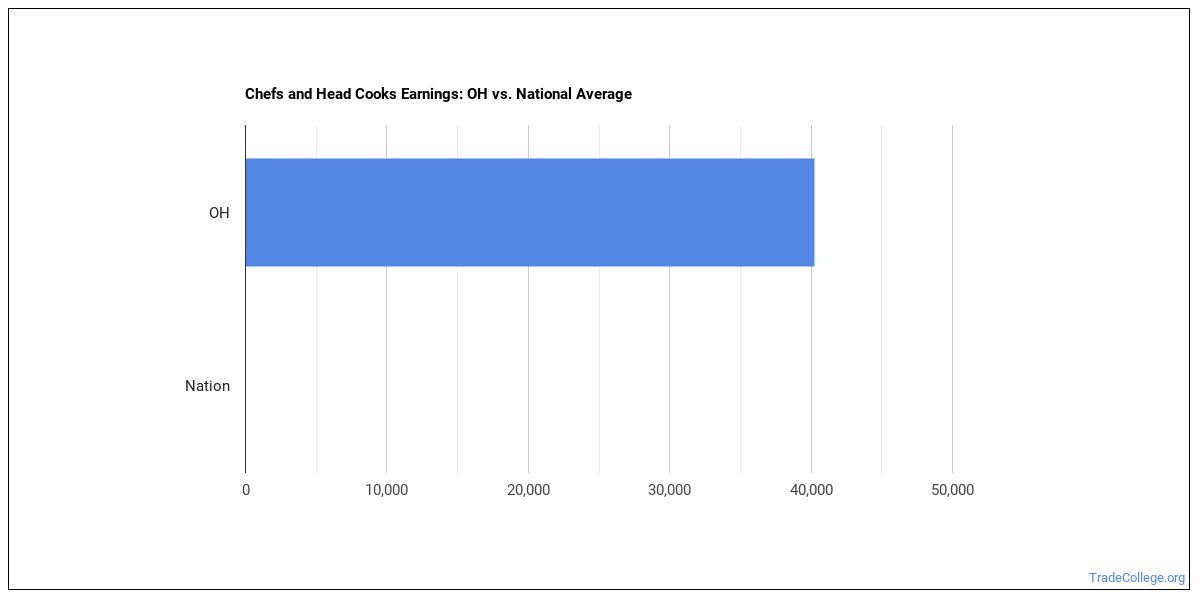
What do Chefs and Head Cooks Make in Ohio?
In 2018 wages for Chefs and Head Cooks ranged from $21,330 to $61,670 with $40,270 being the median annual salary.
Broken down to an hourly rate, workers in this field made anywhere from $10.25 to $29.65. The median hourly rate was $19.36.
In 2017 the median pay for this field was $17.95 an hour.
The hourly rate grew by $1.41.
The median salary in Ohio is higher than the nationwide median salary.
Top Ohio Metros for Chefs and Head Cooks
The table below shows some of the metros in this state with the most Chefs and Head Cooks.
| Metro | Number Employed | Annual Median Salary |
|---|---|---|
| Cleveland-Elyria, OH | 1,300 | $37,890 |
| Columbus, OH | 1,100 | $44,050 |
| Cincinnati, OH-KY-IN | 630 | $43,530 |
| Toledo, OH | 260 | $31,360 |
| Akron, OH | 220 | $39,860 |
| Dayton, OH | 220 | $36,260 |
| Canton-Massillon, OH | 170 | $26,620 |
| Youngstown-Warren-Boardman, OH-PA | 140 | $32,460 |
| Huntington-Ashland, WV-KY-OH | 70 | $64,020 |
| Springfield, OH | 40 | $44,580 |
Top States for Chefs and Head Cooks Employment
The table below shows the states where most Chefs and Head Cooks work.
| State | Number Employed | Annual Median Salary |
|---|---|---|
| California | 19,420 | $46,360 |
| New York | 15,500 | $52,010 |
| Florida | 11,150 | $48,710 |
| Texas | 6,020 | $50,580 |
| Massachusetts | 4,830 | $56,070 |
| Illinois | 4,770 | $49,070 |
| Ohio | 4,370 | $40,270 |
| South Carolina | 3,630 | $38,460 |
| Arizona | 3,580 | $38,430 |
| Nevada | 3,450 | $52,930 |
| Pennsylvania | 3,100 | $57,500 |
| Virginia | 2,790 | $53,000 |
| Connecticut | 2,640 | $53,730 |
| New Jersey | 2,640 | $66,790 |
| North Carolina | 2,460 | $47,070 |
| Maryland | 2,290 | $49,390 |
| Wisconsin | 2,240 | $40,480 |
| Michigan | 2,160 | $48,320 |
| Georgia | 2,060 | $51,330 |
| Tennessee | 1,960 | $45,890 |
Below are the states where Chefs and Head Cooks get paid the most:
| State | Annual Median Salary |
|---|---|
| New Jersey | $66,790 |
| Hawaii | $63,810 |
| District of Columbia | $63,150 |
| West Virginia | $58,570 |
| Pennsylvania | $57,500 |
| Delaware | $57,340 |
| Washington | $56,450 |
| Wyoming | $56,150 |
| Massachusetts | $56,070 |
| Connecticut | $53,730 |
Related Careers in OH
Discover similar careers:
| Occupation | OH Employment Total |
|---|
References
- Bureau of Labor Statistics (BLS)
- College Factual
- National Center for Education Statistics
- O*NET Online
- Image Credit: By U.S. Army Europe Images under License
More about our data sources and methodologies.
TradeCollege.org provides higher-education, college and university, degree, program, career, salary, and other helpful information to students, faculty, institutions, and other internet audiences. Presented information and data are subject to change. Inclusion on this website does not imply or represent a direct relationship with the company, school, or brand. Information, though believed correct at time of publication, may not be correct, and no warranty is provided. Contact the schools to verify any information before relying on it. Financial aid may be available for those who qualify. TradeCollege.org is a for-profit site, and the displayed options may include sponsored or recommended results, not necessarily based on your preferences.
© TradeCollege.org – All Rights Reserved.