Find Trade Colleges
Aerospace Engineering and Operations Technicians in Pennsylvania
Considering a career as an Aerospace Engineering or Operations Technician in Pennsylvania?
Featured schools near , edit
How Many Aerospace Engineering and Operations Technicians Work in Pennsylvania?
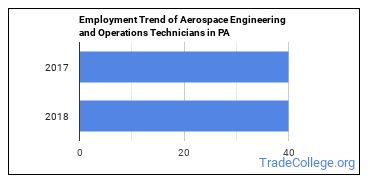
In 2018, there were 40 Aerospace Engineering and Operations Technicians working in the state.
There were 40 Aerospace Engineering and Operations Technicians employed in this state in 2017.
The amount of jobs between 2017 and 2018 is holding steady.

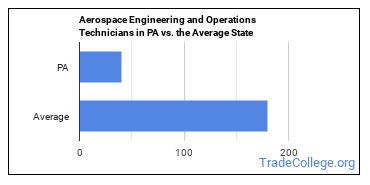
The typical state has 180 Aerospace Engineering and Operations Technicians working in it, which means Pennsylvania has fewer Aerospace Engineering and Operations Technicians than average.

Top Pennsylvania Metros for Aerospace Engineering and Operations Technicians
The table below shows some of the metros in this state with the most Aerospace Engineering and Operations Technicians.
| Metro | Number Employed | Annual Median Salary |
|---|---|---|
| Philadelphia-Camden-Wilmington, PA-NJ-DE-MD | 50 | $89,900 |
Top States for Aerospace Engineering and Operations Technicians Employment
The table below shows the states where most Aerospace Engineering and Operations Technicians work.
| State | Number Employed | Annual Median Salary |
|---|---|---|
| California | 2,660 | $68,420 |
| Texas | 1,000 | $65,980 |
| Ohio | 830 | $67,740 |
| Arizona | 750 | $67,510 |
| Florida | 630 | $60,440 |
| Kansas | 460 | $62,560 |
| Alabama | 420 | $58,050 |
| Washington | 390 | $89,090 |
| Colorado | 340 | $81,200 |
| Maryland | 340 | $66,690 |
| New Mexico | 200 | $71,620 |
| Connecticut | 180 | $63,020 |
| Georgia | 180 | $47,750 |
| Iowa | 170 | $57,750 |
| New York | 160 | $72,490 |
| Utah | 160 | $60,280 |
| Tennessee | 150 | $70,380 |
| Virginia | 140 | $65,690 |
| Oklahoma | 110 | $69,650 |
| Missouri | 70 | $74,620 |
Below are the states where Aerospace Engineering and Operations Technicians get paid the most:
| State | Annual Median Salary |
|---|---|
| Washington | $89,090 |
| Colorado | $81,200 |
| Missouri | $74,620 |
| New York | $72,490 |
| New Mexico | $71,620 |
| Tennessee | $70,380 |
| Oklahoma | $69,650 |
| California | $68,420 |
| Ohio | $67,740 |
| Arizona | $67,510 |
Related Careers in PA
You may also be interested in the following careers:
| Occupation | PA Employment Total |
|---|
References
- Bureau of Labor Statistics (BLS)
- College Factual
- National Center for Education Statistics
- O*NET Online
More about our data sources and methodologies.
